
Figures & data
Table 1. Patient and treatment characteristics.
Figure 1. Cox proportional-hazard regression of lung toxicity, considering G ≥ 1, for different irradiation techniques.
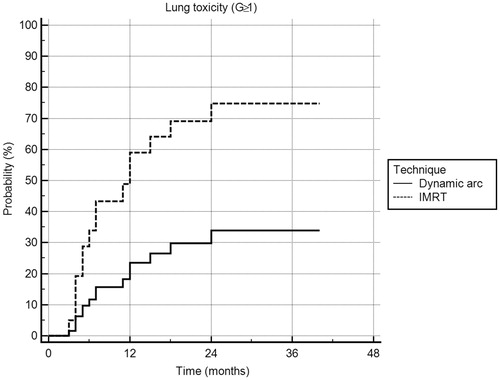
Table 2. Statistical analysis of pulmonary toxicity.
Figure 2. Histogram of local control distribution at increasing BED. Three subpopulations were identified, corresponding to patients treated with BED ≤40 Gy, 40 Gy < BED <60 Gy and BED ≥60 Gy. Local control is defined as 0 (there is not local disease progression, black columns). Otherwise, local control is defined as one if local disease progression was found (grey columns).
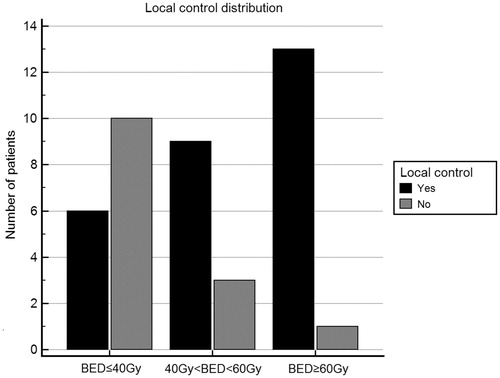
Table 3. Cox proportional-hazard regression analysis of the effect of dosimetric parameters upon local control.
Table 4. Radiologic response evaluated according to RECIST criteria [21] at 6 months.