Figures & data
Figure 1. Representative dose color-wash distribution for post-prostatectomy PT using opposed lateral beams—contours: CTV (pink), PTV (navy), bladder (yellow), rectum (brown), right femoral head (orange), left femoral head (green), and ERB (purple). Daily imaging and alignment technique using the ERB with diluted contrast for visualization and alignment of the ARW with the PB CTV on daily kV-kV imaging.
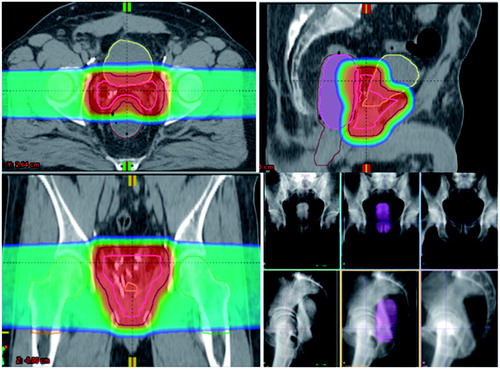
Table 1. Post-prostatectomy PT cohort baseline demographic, clinical, and treatment characteristics.
Table 2. Acute and late maximum GU and GI CTCAE v 4.0 toxicities for post-prostatectomy PT.
Table 3. Frequency of specific maximum GU grade 2 toxicities with post-prostatectomy PT.
Figure 2. Kaplan-Meier survival estimates for late (A) GU grade 2 and (B) GI grade 1 toxicity–free survival for post-prostatectomy PT.
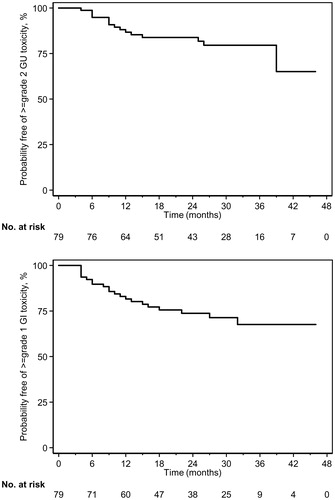
Figure 3. Patient reported outcomes (mean ± standard deviation) at baseline and after post-prostatectomy PT.
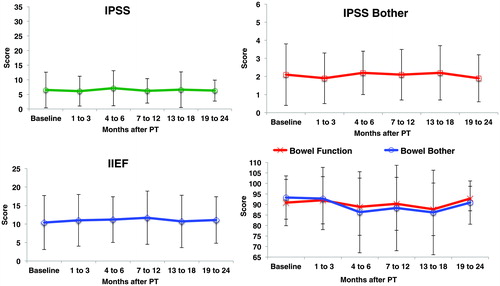
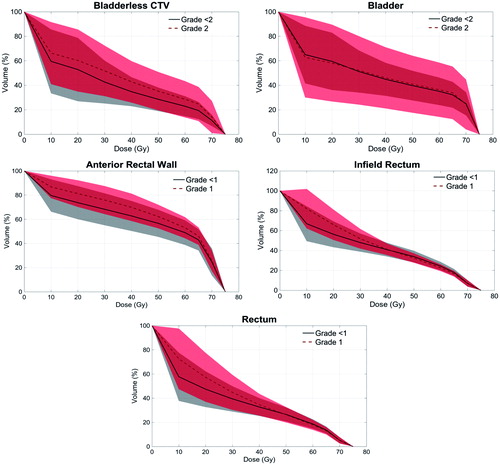
Figure 4. Comparative mean dose volume histograms for bladder-related parameters and GU and rectal-related parameters and GI acute toxicities. The shaded regions (gray and pink) represent the standard deviations for each curve with the red shaded region representing the area of overlap between the 2 curves.