
Figures & data
Figure 1. Study recruitment and follow-up.
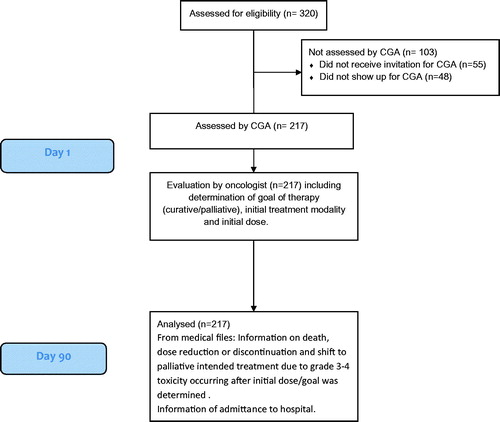
Table 1. Baseline characteristics of patients receiving CGA in the total population and in relation to the CGA classification ‘fit’, ‘vulnerable’, and ‘frail’.
Table 2. Initially planned cancer treatment and interventions provided following CGA in the total population and in relation to the CGA classification ‘fit’, ‘vulnerable’, and ‘frail’.
Table 3. Comparison of complications in relation to initial CGA according to fit, vulnerable, and frail cancer patients.
Supplemental material