Figures & data
Figure 1. The patients wore video Googles for feedback. The height of a green bar visualized the amplitude of the thoracic point, a blue line visualized the baseline, i.e., the expiration phase in free breathing and a yellow rectangle visualized the gating window within which the top edge of the bar should be located during DIBH. The amplitude of the surface point was time stamped and stored in the BSLS computer together with CT beam-on events. Audial instructions were automatically given every 15 s from the BSLS system via loudspeakers.
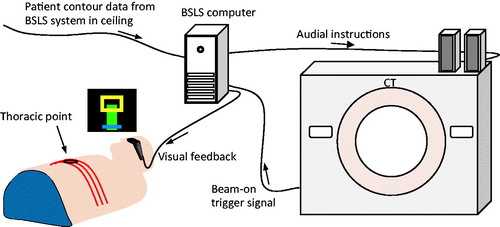
Figure 2. Typical data acquisition pattern during one setup (patient 2, CT2). The amplitude of the thoracic surface point (black) is shown together with start and stop times for the 12 bursts (gray vertical lines). Each burst contained five exposures and the start time of each burst was randomly chosen within each DIBH period. Three different couch (bed) positions were imaged.
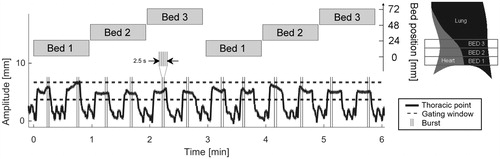
Figure 3. For each bed position, a point B at the anterior part of the medulla was set as origin for an anatomical coordinate system. A corresponding point A at the anterior part of the sternum was defined to yield the anterior–posterior axis AB. Starting from the center of AB at C, a second line was constructed perpendicular to AB reaching the lateral edge of the left lung at D. The line AD was used as reference for scoring MHD (maximum heart distance) and MLD (maximum lung distance). The reference line is roughly parallel to the treatment beam edges motivating its use as reference for distance measurements. The spine-to-couch distance h was measured to quantify the number of cases when the patient lifted the back more than 3 mm, i.e., made ‘fake-breaths’.
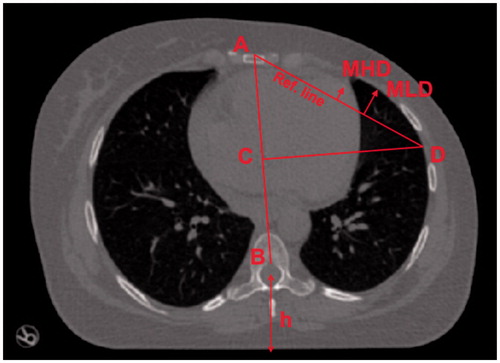
Table 1. The variability of two measures; the maximum heart distance (MHD) and maximum lung distance (MLD), both in terms of pooled standard deviation across patients (pooled SD and 95% confidence interval, CI) and the mean value of all patients’ max range (range and standard deviation, SD).
Figure 4. Standard deviations (upper two panels) and max range (lower two panels) for MHD and MLD are given per patient. All data are for bed 2. Beds 1 and 3 had similar distributions. The patients are sorted according to descending Total MHD max range.
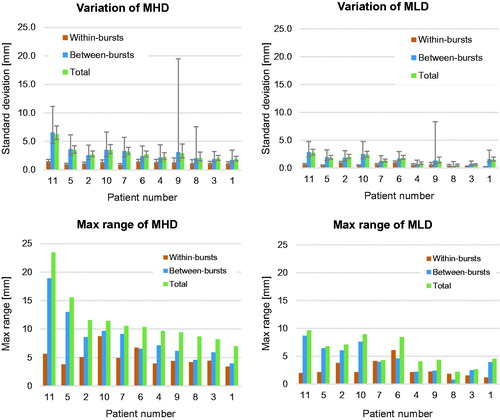
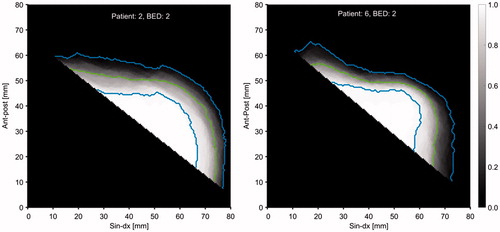
Figure 5. Merged axial view of the HE distribution for all CT scans at bed 2 for patient 2 (left) and bed 2 for patient 6 (right). The gray scale gives the relative number of times the heart covered a specific pixel. The green lines give the 50% levels and the blue lines give the 5% and 95% levels.