
Figures & data
Figure 1. Physical changes in the thorax with continuous positive airway pressure (CPAP) compared to free-breathing in patients with different cardiac–thoracic anatomy. Digitally reconstructed radiographs (top) and axial images (bottom) from computed tomography simulation scans representative thoracic changes with free-breathing and after 30 min of CPAP breathing under the individual maximum tolerable air pressure (between 6 and 15 cmH2O with 0.21 of fraction of inspired oxygen with the use of a mask interface) in patients with different cardiac–thoracic anatomy (CTA). Unfavorable CTA was defined per Taylor et al.,5 the maximum distance >1 cm between the heart contour and the posterior edge of the tangent field as measured on computed tomography simulation with FB. Chest wall deformity with pectus excavatum was considered as challenging CTA. If the patient did not meet the two descriptions stated above, the patient was categorized as favorable CTA. Panel A, B, and C shows patient with favorable-, unfavorable-, and challenging CTA, respectively (Supplementary Figures S1 A and B with favorable- and challenging CTA, respectively).
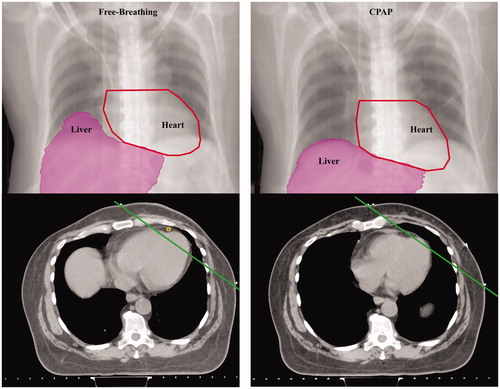
Table 1. Physical changes in the thorax with continuous positive airway pressure compared to free-breathing in patients with different cardiac–thoracic anatomy.
Table 2. Continuous positive airway pressure effects on radiation doses to organs at risks compared to free-breathing in patients with different cardiac–thoracic anatomy.