
Figures & data
Table 1. Incident cases of kidney cancer in adults (age ≥15 years) in Estonia, 1995–2014.
Figure 1. (A) Observed (dashed line) and modeled (solid line) age-standardized (World) rates and annual percentage change (APC) with 95% confidence intervals for kidney cancer incidence (1970–2014) and mortality (1995–2014) trends in Estonia; (B) Age-specific kidney cancer incidence trends by five-year birth cohort and period of diagnosis in Estonia, 1970–2014; (C) Observed (dashed line) and modeled (solid line) age-standardized (World) rates and annual percentage change (APC) with 95% confidence intervals for stage-specific kidney cancer incidence trends in Estonia, 1970–2014. *The APC is significantly different from zero at alpha =0.05.
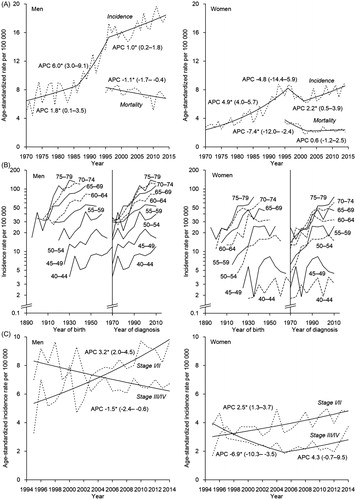
Table 2. Five-year relative survival ratios (RSR) for all kidney cancers and renal cell carcinoma in Estonia, 1995–2014.
Table 3. Excess hazard ratio (EHR) of death within five years of diagnosis among patients with kidney cancer in Estonia, 1995–2014.