
Figures & data
Figure 1. CT-image of Phantom for CT and MRI. The phantom consists of a plastic box filled with agarose gel and two fiducials. The appearance of the fiducials (Gold Anchor®) is shown as photo, on MRI (T2 TSE, T1 VIBE *Dixon and R2*) and on CT.
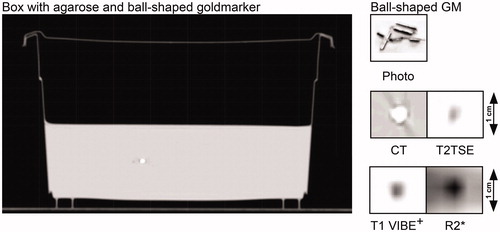
Table 1. Specifications of used MRI-sequences.
Figure 2. Match of a centrally and a peripherally inserted fiducial. The CT-image (3 dimensions) of (a) a centrally and (b) a peripherally inserted goldmarker are given with the colored contours of the matched T2 TSE sequences of three different MR-scanners (Symphony, Aera, Skyra)*. The scale of 10mm indicates the magnification. *Siemens Healthcare GmbH, Erlangen, Germany.
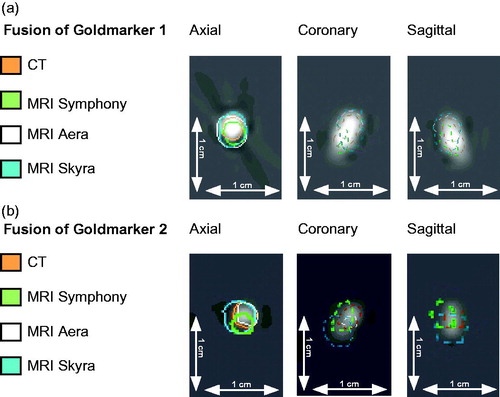
Figure 3. MR-image fusion workflow in a clinical study. (a) Image registration by GM using R2*-sequence from 3 T MRI (Skyra)*. (b) Consecutive match of T2 TSE sequence for tumor delineation. (c) Match of a weekly derived T2 TSE sequences using the marker-matched T2 TSE sequence (b) for registration on anatomical identical intraprostatic points (MRI-MRI-match). For details, see the method section. *Siemens Healthcare GmbH, Erlangen, Germany.
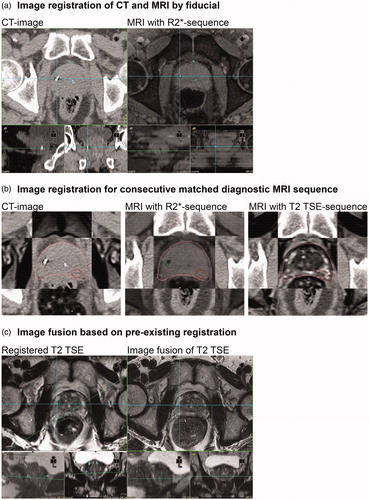
Table 2. Volumes of the gel-contour and the goldmarker-contours. Additionally the deviations of the midpoint of the gel contours in the MRI sequences compared to CT.
Table 3. Spatial deviations of two fiducials in all dimensions.
Table 4. Results of CT-MRI registration and T2 TSE-based MRI-MRI registration of 10 patient samples each.