
Figures & data
Figure 1. Average time needed to modify contours of 11 cardiac substructures per patient for the first 10 patients (clear bars) and for the second 10 patients (solid bars). Error bars represent one standard deviation. LA: left atrium; LV: left ventricle; RA: right atrium; RV: right ventricle; SVC: superior vena cava; IVC: inferior vena cava; PA: pulmonary artery; PV: pulmonary vein; DA: descending aorta; AA: ascending aorta.
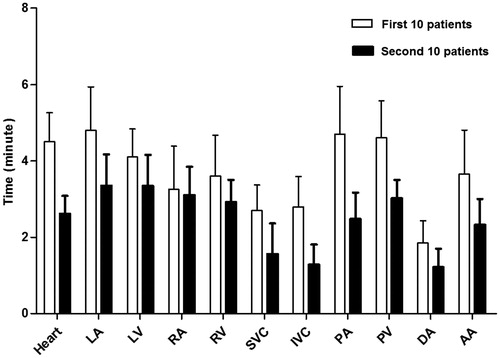
Figure 2. Comparison of auto-segmented contours (solid lines) and modified contours (colorwash) for patients (a) and (b) in the axial, sagittal and coronal views. LA: left atrium; LV: left ventricle; RA: right atrium; RV: right ventricle; SVC: superior vena cava; IVC: inferior vena cava; PA: pulmonary artery; PV: pulmonary vein; DA: descending aorta; AA: ascending aorta.
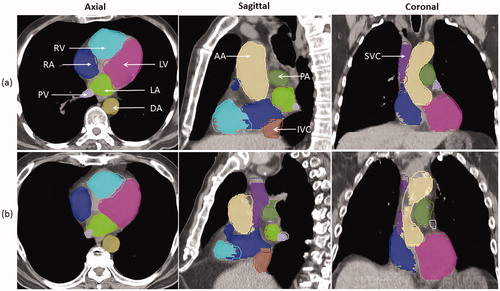
Figure 3. Dose-volume histogram analyses of modified contours (solid lines) are compared with auto-segmented contours (dotted lines) for the two patients (a) and (b) shown in Figure 2. Both patients were treated with passive scattering proton beam therapy. LA: left atrium; LV: left ventricle; RA, right atrium; RV: right ventricle; SVC: superior vena cava; IVC: inferior vena cava; PA: pulmonary artery; PV: pulmonary vein; DA: descending aorta; AA: ascending aorta.
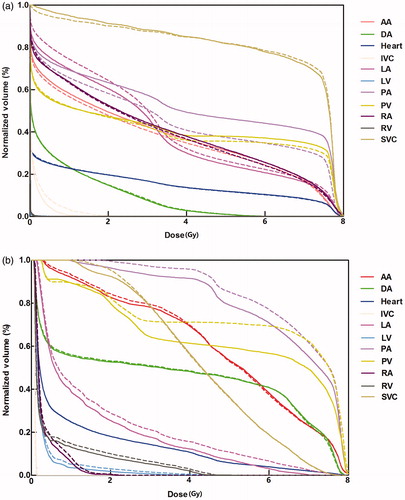
Table 1. Comparison of modified contours versus auto-segmented contours of 11 cardiac substructures.
Table 2. Dosimetric comparability of modified contours versus auto-segmented contours.