
Figures & data
Figure 1. CONSORT diagram.
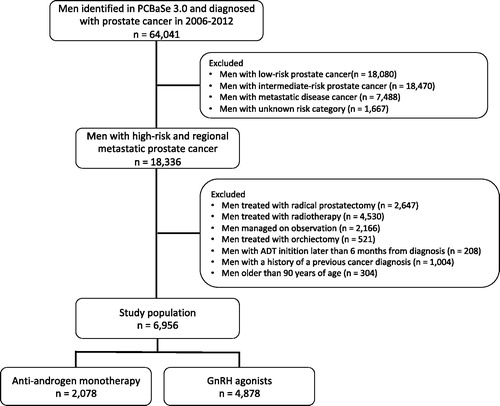
Figure 2. First event of conversion from AA to GnRH agonist, death from other causes or death from PCa assessed in competing risk analyses among men who started on anti-androgen monotherapy (AA) in competing risk analyses.
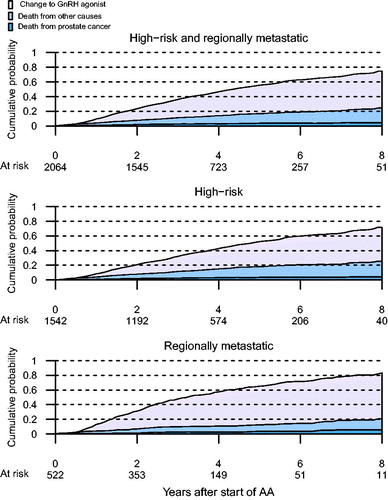
Table 1. Baseline characteristics of men in PCBaSe 3.0 diagnosed with high-risk and regionally metastatic prostate cancer in 2006–2012 and treated with anti-androgen monotherapy or GnRH agonists.
Figure 3. Cumulative probability of death from PCa or death from other causes for men on anti-androgen monotherapy (AA) and men on GnRH agonists.
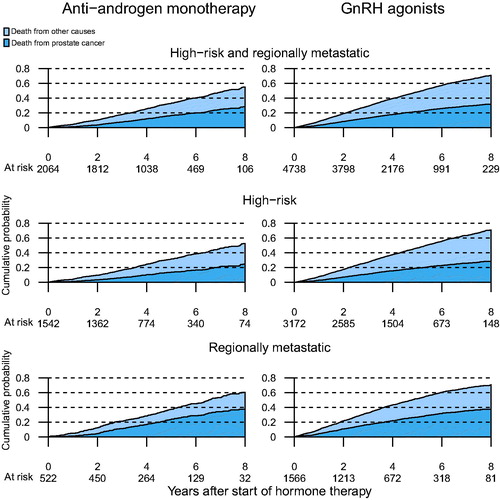
Table 2. Risk of death from prostate cancer or death from all causes in men on primary anti-androgen monotherapy or GnRH agonists.
Figure 4. Probability of PCa death and death from all causes following propensity score matched for men on anti-androgen monotherapy (AA) and GnRH agonists, assessed with 1-Kaplan-Meier estimates.
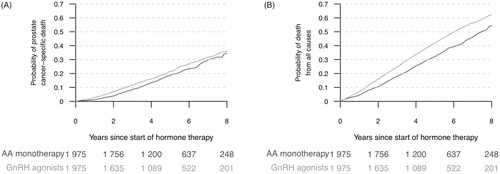
Table 3. Risk of death from prostate cancer or death from all causes for men on primary GnRH agonists or anti-androgen monotherapy (AA, reference in analyses) following propensity score matching.