Figures & data
Figure 1. Patient selection for the DISCO study.
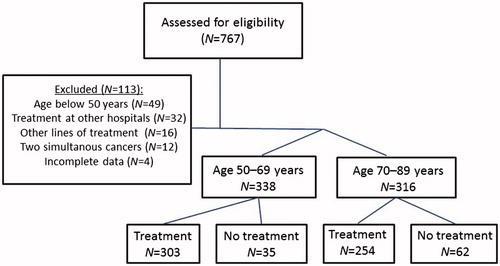
Table 1. Baseline characteristics for all treated and non-treated patients.
Table 2. Association between baseline characteristics, treatment, and outcomes.
Figure 2. Treatment outcomes comparing treated and non-treated patients stratified by age. (A) PFS; higher risk of progression for older compared with younger treated patients (p < .01), but after adjustments for PS and comorbidity there was no significant difference (ap = .11). (B) OS; higher risk of all-cause mortality for older compared with younger treated patients (ap < .01). No difference in non-treated patients (p = .40). (C) CRC-mortality; no age-dependent difference was found in risk of CRC-related death for treated (p = .16) or non-treated patients (p = .07). (D) Other causes of death; higher risk of non-CRC-related death in older compared with younger treated patients (ap < .01) No difference in non-treated patients (p = 0.17).
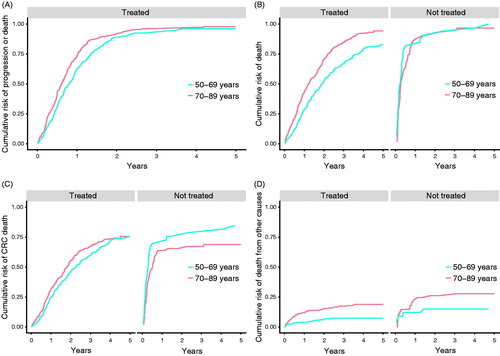
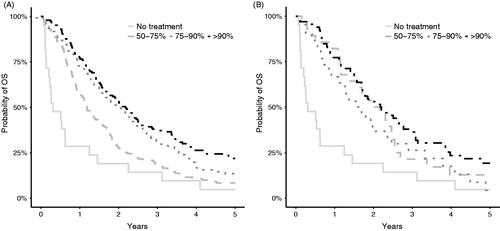
Figure 3. Kaplan–Meier curves showing PFS for patients with PS 0 and 1 given different dose intensities of chemotherapy as a monotherapy or as part of combination chemotherapy. (A) Patients given 5-FU/ capecitabine. (B) Patients given irinotecan.
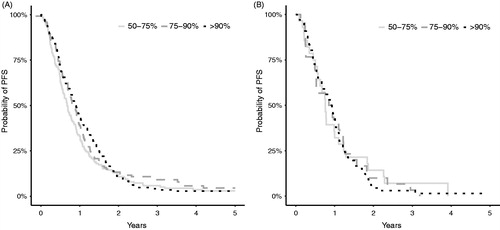
Figure 4. Kaplan–Meier curves showing OS for patients with PS 0 and 1 given different dose intensities of chemotherapy as a monotherapy or as part of combination chemotherapy. Non-treated patients (dose = 0) are included. (A) Patients given 5-FU/ capecitabine. (B) Patients given irinotecan.