Figures & data
Table 1. Cancer location and time to primary malignancy.
Table 2. Primary colorectal examination.
Table 3. Subjects with elevated cancer-associated biomarkers.
Figure 1. Cumulative incidence of malignancy according to plasma/serum levels of A: CEA (p = .0008), B: TIMP-1 (p = .02), C: CA19-9 (p = .002) and D: YKL-40 (p = .002). The solid blue lines represent normal levels of the cancer-associated biomarkers with 95% CI. The dotted red lines represent elevated levels of the cancer-associated biomarkers with 95% CI.
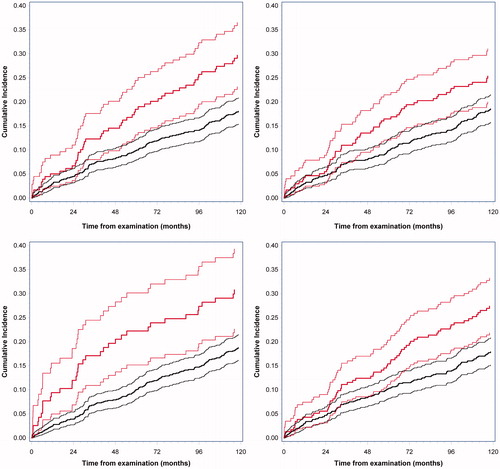
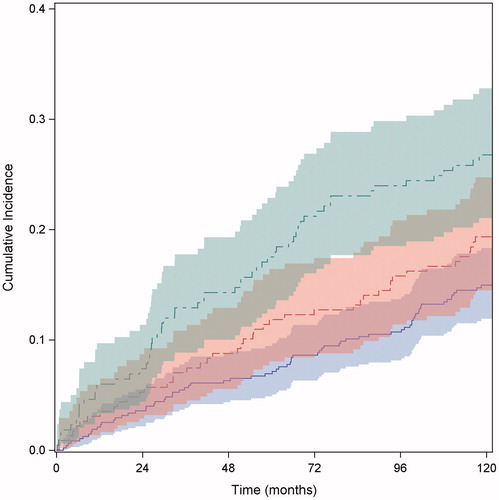
Figure 2. Cumulative incidence of malignancy according to the multivariate analysis including the three defined groups (p = .0009). The solid blue line with 95% CI, represents group 0 with none of the four biomarkers elevated. The dotted red line with 95% CI, represents group 1, with one of the four biomarkers elevated. The dotted green line with 95% CI, represents group 2, with two or more of the four biomarkers elevated.