Figures & data
Table 1. Comparison of patient, tumor and treatment characteristics in the development and validation cohort.
Figure 1. ROC curve for the validation cohort.
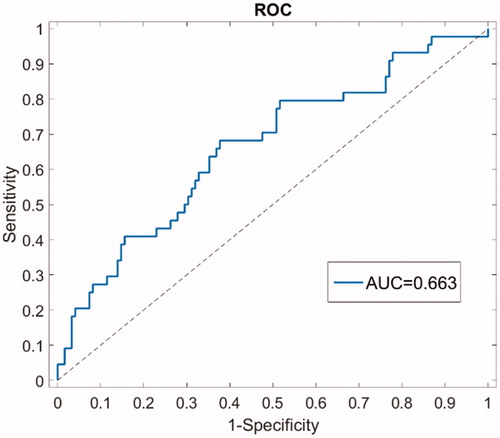
Figure 2. Calibration plot for model training.
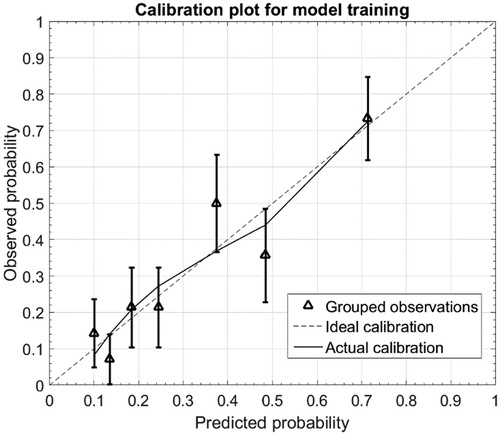
Figure 3. Calibration plot for model validation.
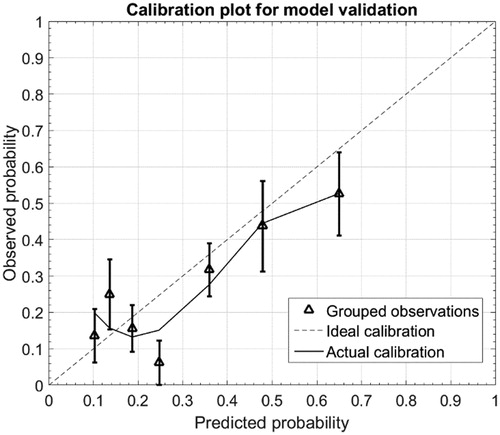
Table 2. Performance of the NTCP model.
Table 3. Univariable analysis for unfavourable aesthetic outcome in development and validation cohort.
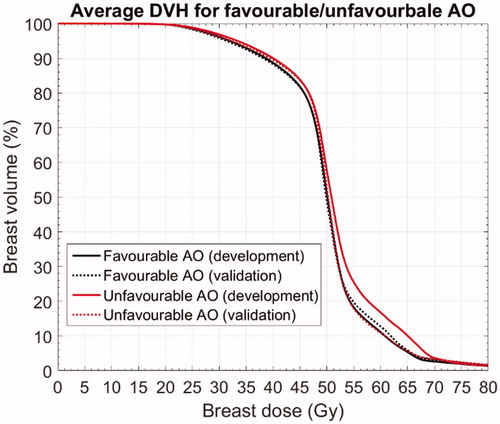
Figure 4. Average DVHs for favourable and unfavourable aesthetic outcome in the development and validation cohort.