Figures & data
Figure 1. Flow diagram illustrating identification of the cohort of patients treated operatively for metastatic bone disease of the extremities in the Capital Region of Denmark (total population 1.81 million) from 19 May 2014 to 18 May 2016. MDT: highly specialised multidisciplinary team; MTC: musculoskeletal tumor center; SSG: secondary surgical centers.
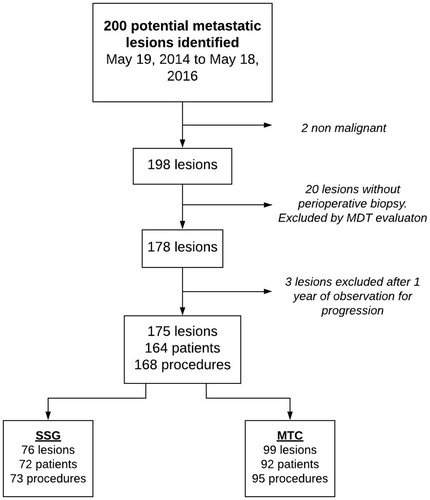
Table 1. Table describing and comparing the preoperative data of the cohort of patients treated operatively for metastatic bone disease of the extremities in the Capital Region of Denmark (total population 1.81 million) from 19 May 2014 to 18 May 2016.
Figure 2. Figure illustrating the anatomical sites of treated metastatic lesions and method of surgical management of the cohort of patients treated operatively for metastatic bone disease of the extremities in the Capital Region of Denmark (total population 1.81 million) from 19 May 2014 to 18 May 2016. rTSA: reverse total shoulder arthroplasty; THA: Total Hip Arthroplasty.
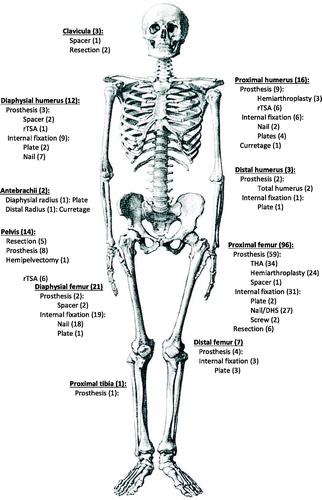
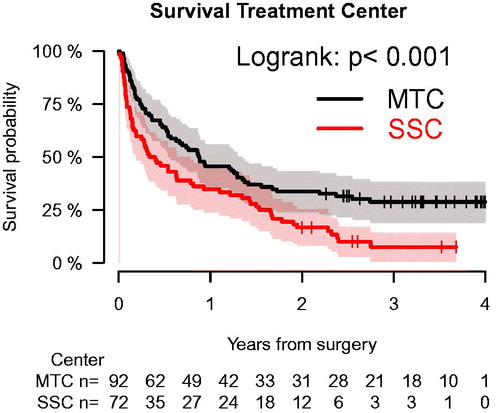
Figure 3. Kaplan–Meier survival analysis showing cumulated overall survival for a population-based cohort of patients having surgery for metastatic bone disease in the extremities in the Capital Region of Denmark (total population 1.81 million) stratified for treatment center. Patients were only included into analysis at index surgery during the study (n = 164). Overall one-year survival for the entire cohort was 41% (95% C.I.: 33%–48%) and 46% (95% C.I.:36%–56%) versus 35% (95% C.I.: 24%–46%) for patients treated at a musculoskeletal tumor center or a secondary surgical center, respectively (p < .001).