Figures & data
Figure 1. Flowchart of the patient selection.
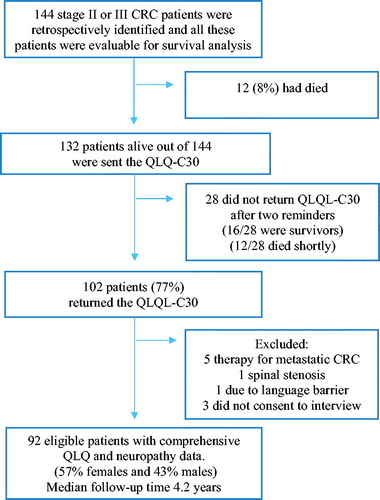
Table 1. Patient characteristics.
Table 2. Oxaliplatin starting month with number of patients, mean temperature, mean duration of oxaliplatin treatment, and percentage (%) of patients with acute grades 2–4 neurotoxicity and long-term grades 2– neuropathy.
Figure 2. Proportion of patients with different grades of acute neurotoxicity (upper panel) and long-term neuropathy (lower panel) in CAPOX and FOLFOX groups. There were no statistically significant differences between the groups (Chi-square).
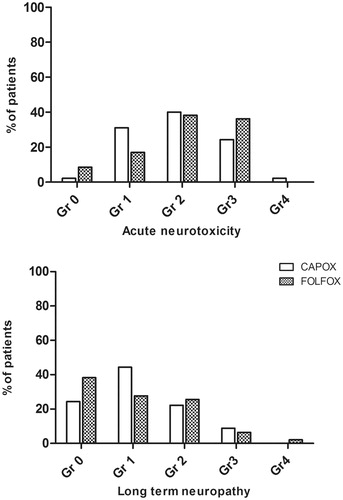
Table 3. Predictors of acute neurotoxicity and long-term neuropathy from the multivariate logistic regression models, with odds ratio (OR), 95% confidence intervals (CIs) and p value (p).
Table 4. Number (n = 92) and proportion of patients reporting any grade (‘A little’, ‘Quite a bit’, or ‘Very much’) or severe (‘Quite a bit’ or ‘Very much’) symptoms on a EORTC QLQ-CIPN20 questionnaire at the long-term follow up (median 4.2 years, range 2.6–8.9).
Figure 3. Symptom scores for sensory (left) and motor (right) items in the EORTC QLQ-CIPN20 questionnaire for CAPOX and FOLFOX groups. Higher scores mean more symptoms/problems. Data are presented as mean values with standard deviation. There were no statistically significant differences between the groups (Mann–Whithey U test).
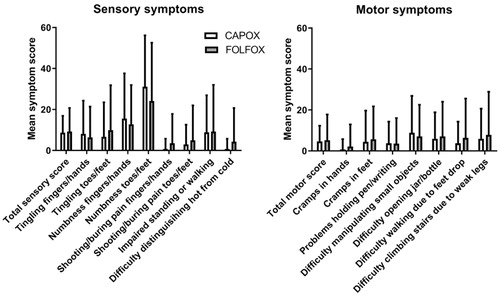
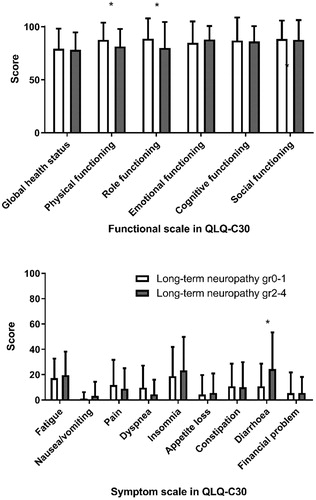
Figure 4. Mean scores (with upper limit of 95% confidence interval) of functional (above) and symptom (below) scales in QLQ-C30, in patients with long term neuropathy grades 0 and 1 and in patients with long-term neuropathy grades 2–4. *Statistically significant difference between the groups.