
Figures & data
Table 1. Socio-demographic characteristics of the overall study population and stratified for receptiveness towards technology.
Table 2. Mean READHY scores stratified for participants’ receptiveness towards technology.
Table 3. Four READHY profiles identified by cluster analysis.
Table 4. Sociodemographic characteristics of the four READHY profiles based on cluster analysis.
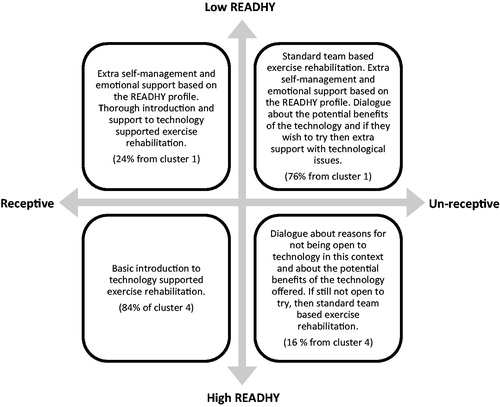
Figure 1. Proposed model for balanced interventions based on the degree of health technology readiness and receptiveness for technology supported physical exercise.
Supplemental material