
Figures & data
Figure 1. Flowchart showing the patient inclusion and exclusion. 1Inconclusive/no findings with both ERUS and MRI, for example, patient with pacemaker and tumor beyond the reach of the ultrasound probe.
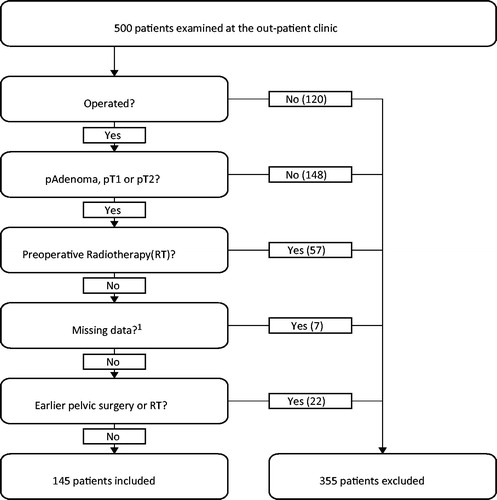
Table 1. Patient characteristics.
Figure 2. Diagrams showing the T-staging accuracy of ultrasound (left) and magnetic resonance imaging (MRI) (right), based on the 76 patients with conclusive results from both MRI and endorectal ultrasound (ERUS). Correctly staged tumors are marked with a thick line. Colors indicate tentative staging, with blue indicating adenomas, green cT1, purple cT2, red cT3, and gray cT4. ERUS overstaged 4 adenomas (2 T1, 1 T2, and 1 T3), 16 T1 tumors (11 T2 and 5 T3), and 16 T2 tumors (15 T3 and 1 T4). ERUS also understaged 4 T1 tumors and 5 T2 tumors (4 T1, 1 adenoma). MRI overstaged 18 adenomas (14 T1, 3 T2, and 1 T3), 9 T1 tumors (7 T2 and 2 T3) and 12 T2 tumors (12 T3). MRI understaged 1 T1 tumor and 9 T2 tumors (9 T1).
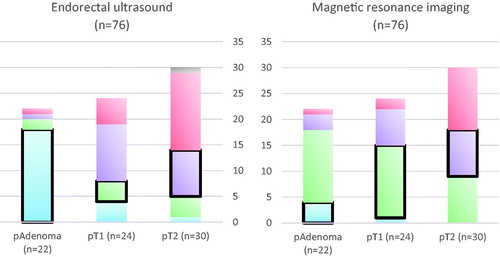
Table 2. Sensitivity, specificity, and accuracy of ERUS and MRI for staging adenomas and pT1 and pT2 rectal cancers, based on the 76 patients with both conclusive MRI and conclusive ERUS.
Table 3. Summary of the sensitivity, specificity, PPV, NPV, and accuracy of the different means of preoperative examination.