Figures & data
Figure 1. DECT scan demonstrating histogram of effective-z values obtained from monochromatic images at 70 KeV. The top left image is from a malignant tumor with its corresponding effective-z histogram. Middle left is from a benign tumor with its corresponding effective-z histogram. Bottom left is from normal bowel tissue, bottom right shows line graphs for malignant, benign and normal tissue illustrating the difference in HU values at different energy levels in monochromatic images. Circular Roi’s are drawn as large as possible to cover as much of the tumor as possible.
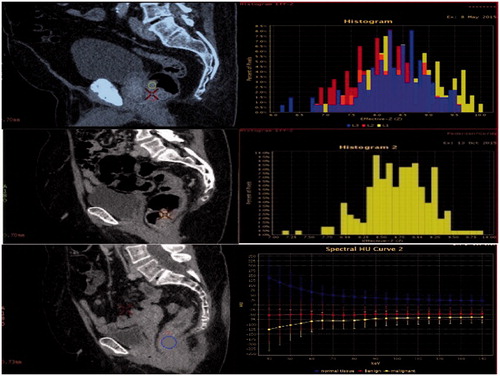
Table 1. Distribution of the mean age and sex of the included subjects. The distribution of the grade of dysplasia and types of adenomas for the benign group, and the T-stages and grade of differentiation for the malignant group.
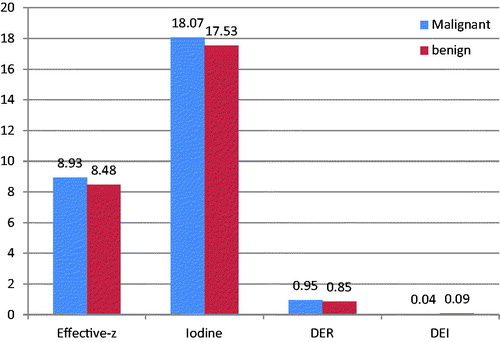
Figure 2. Box graph illustrating the differences in means for all the measured DECT specific quantitative parameters.