Figures & data
Figure 1. Synchrony errors and inter-model SD of radial errors for 72 patients. Synchrony errors are shown in different anatomical directions (a) and radially (b). Red boxplots (a, b) indicate the mean error for each patient across all their models while the blue boxplot (b) indicates the inter-model standard deviations (SD) across all models for each patient. (b) The length of the bar is proportional to the number of patients within each bin.
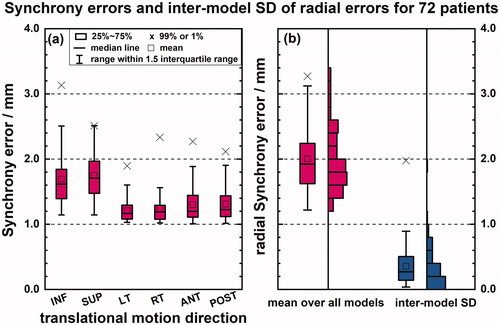
Figure 2. The offsets of correlation (a) and predictor errors (b) across eight respiratory phases for 72 patients. The red boxplots indicate the mean error across eight respiratory phases across all patients while the blue boxplots indicate the inter-phase SD across eight respiratory phases for each patient.
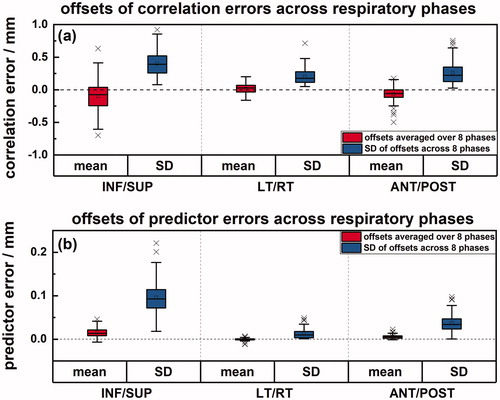
Figure 3. Inter- and intra- fractional variations of rotational corrections for 23 patients in roll (a), pitch (b) and yaw (c). Rotational corrections per X-ray image pair are grouped by fraction for these patients. Each vertical data cluster represents the 5th to 95th percentile of the rotational corrections per fraction. Clusters belonging to individuals alternate between red and blue. The dashed lines indicate the thresholds of rotations for which the system can correct. Three patients with the largest rotational corrections had 2 to 3 distinct large lesions with fiducials in the most inferior segment (VI) of the liver closest to the bowel structures. (d) The changes to D95 and D99 as a fraction of the prescribed dose for the 23 patients (31 targets) with accurate rotations. The arrows indicate three targets that were treated with compromised plans.
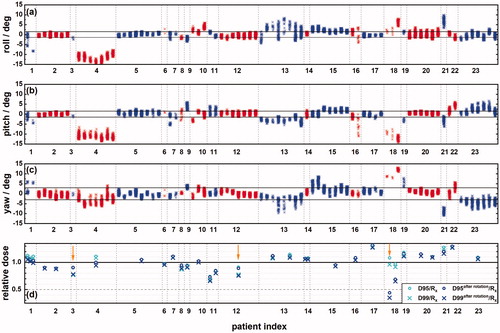
Table 1. Percentage change in D99/Rx after rotations applied for 72 patients (98 GTVs).
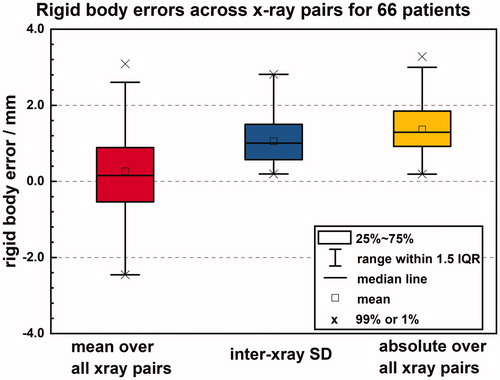
Figure 4. Rigid body errors across X-ray pairs for 66 patients. The mean, inter-x-ray SD, and absolute values of signed rigid body errors across all X-rays for each patient.