2,798
Views
11
CrossRef citations to date
0
Altmetric
ORIGINAL ARTICLES: RADIOTHERAPY

Early and late side effects, dosimetric parameters and quality of life after proton beam therapy and IMRT for prostate cancer: a matched-pair analysis

, , , , , & show all
Pages 916-925 | Received 22 Oct 2018, Accepted 06 Feb 2019, Published online: 18 Mar 2019

Figures & data

Table 1. Clinical parameters of the patients included in the matched-pair analysis.

Figure 1. Overall genitourinary (GU) and gastrointestinal (GI) toxicities up to 3 months after radiotherapy (early) and at 12 months after RT (late). IMRT: intensity-modulated radiotherapy; PBT: proton beam therapy.

Figure 1. Overall genitourinary (GU) and gastrointestinal (GI) toxicities up to 3 months after radiotherapy (early) and at 12 months after RT (late). IMRT: intensity-modulated radiotherapy; PBT: proton beam therapy.

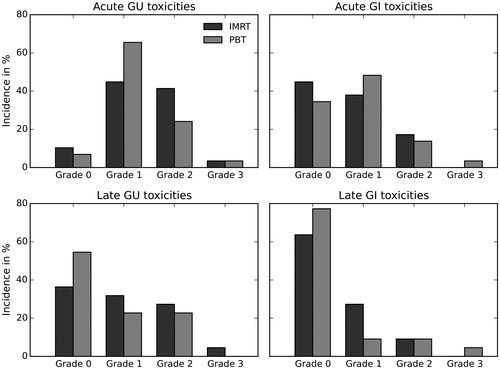
Table 2. Early and late (12 months after radiotherapy) genitourinary (GU) and gastrointestinal (GI) side effects according to CTCAE version 4.0.

Figure 2. Logistic regression models for late genitourinary (GU) symptoms grade ≥2 as a function of the relative volume of the anterior bladder wall receiving at least 70 Gy (a) and late obstruction grade ≥2 as a function of the relative volume of the bladder receiving at least 60 Gy (b) based on proton beam therapy (PBT, solid lines) and intensity-modulated radiotherapy (IMRT, dashed lines). Data points represent mean incidence rates and mean values of the corresponding dose–volume parameter of equally sized patient groups, standard deviations are visualized by bars.

Figure 2. Logistic regression models for late genitourinary (GU) symptoms grade ≥2 as a function of the relative volume of the anterior bladder wall receiving at least 70 Gy (a) and late obstruction grade ≥2 as a function of the relative volume of the bladder receiving at least 60 Gy (b) based on proton beam therapy (PBT, solid lines) and intensity-modulated radiotherapy (IMRT, dashed lines). Data points represent mean incidence rates and mean values of the corresponding dose–volume parameter of equally sized patient groups, standard deviations are visualized by bars.

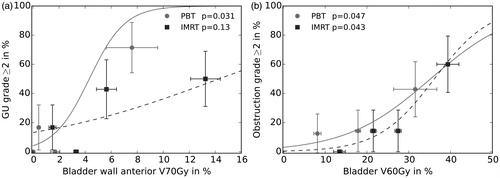
Table 3. Logistic regression of late (12 months after radiotherapy) genitourinary symptoms and dose–volume parameters of the entire bladder wall and anterior bladder wall.

Table 4. Quality of life score differences for the EORTC QLQ-C30 and EORTC QLQ-PR25 questionnaires 3 months after RT vs baseline and 12 months after RT vs baseline for the IMRT and PBT group.

Supplemental material

Supplemental Material

Download PDF (1.5 MB)

Reprints and Corporate Permissions

Please note: Selecting permissions does not provide access to the full text of the article, please see our help page How do I view content?

To request a reprint or corporate permissions for this article, please click on the relevant link below:

Academic Permissions

Please note: Selecting permissions does not provide access to the full text of the article, please see our help page How do I view content?

Obtain permissions instantly via Rightslink by clicking on the button below:

If you are unable to obtain permissions via Rightslink, please complete and submit this Permissions form. For more information, please visit our Permissions help page.