
Figures & data
Table 1. Baseline characteristics of the study population (n = 195).
Figure 1. Kaplan-Meier plots showing freedom from locoregional progression, freedom from any progression, disease-specific survival, overall survival, and disease-free survival.
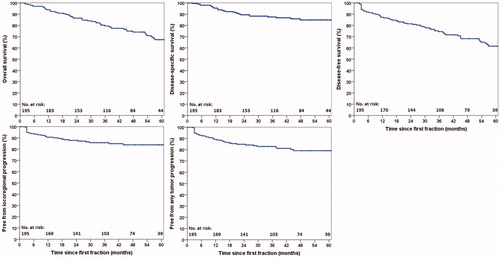
Figure 2. Kaplan-Meier plots showing cumulative incidence of late grade ≥3 toxicity in 182 patients.
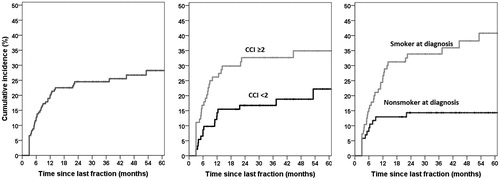
Figure 3. Kaplan-Meier plots showing cumulative incidence of specific late grade ≥3 toxicity in 182 patients.
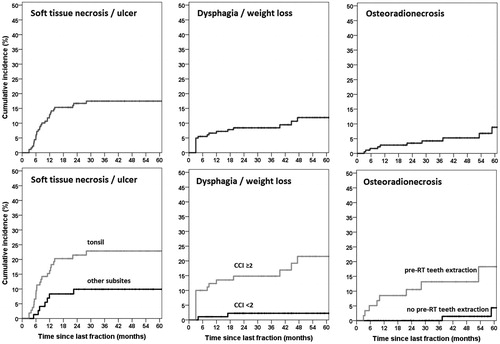
Table 2. Distribution of maximum toxicity scores in 182 evaluated patients (crude numbers).
Table 3. Prognostic factors for grade ≥3 late toxicity.
Supplemental material