Figures & data
Figure 1. Numbers of patients identified and analyzed, stratified by histopathologic subtype (endometrioid endometrial carcinoma, EEC; non-endometrioid endometrial carcinoma, NEC) and age at diagnosis.
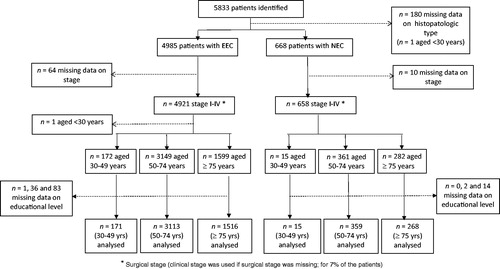
Figure 2. Age-specific incidence rates of endometrioid endometrial carcinoma (EEC) according to stage at diagnosis for the female population of the Western Swedish Health Care Region (1995–2016). The stage-II, stage-III, and stage-IV incidence rates are presented in a separate graph with a magnified scale on the y-axis.
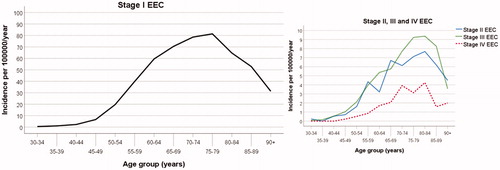
Table 1. EEC stratified by age at diagnosis and educational level and stage distribution.
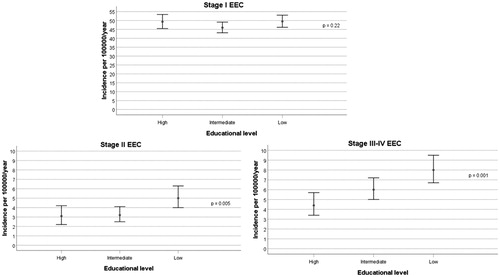
Figure 3. Stage-specific incidence rates of endometrioid endometrial carcinoma (EEC) for the 50- to 74-year-old female population of the Western Swedish Healthcare Region (1995–2016). Estimates of the incidence rates with 95% CIs are shown for each population group according to the women’s level of education (low, medium, high). The p-values were obtained by testing the null hypothesis of no difference in incidence rates in the population groups with different levels of education.