
Figures & data
Table 1. Demographics.
Figure 1. OC1 vs OC2 with 95% LA. On the left-hand side a scatter plot comparing in-situ measurements of both colonoscopies. On the right-hand side a Bland–Altman plot showing the differences between the measurements in comparison to the average of both measurements as well as 95% limits of agreement (horizontal lines on equal distance from the mean). OC1: primary optical colonoscopy. OC2: secondary optical colonoscopy. LA: limits of agreement.
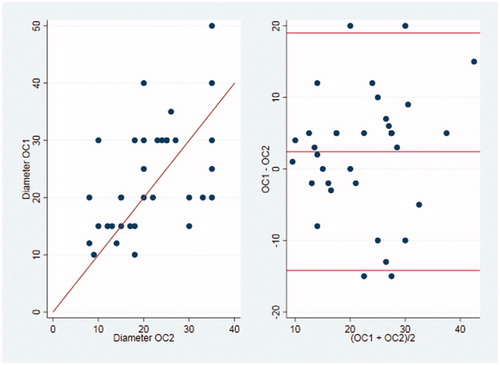
Table 2. Average difference between size measurements.
Table 3. Agreement on ≥20 mm polyp sizes.