
Figures & data
Table 1. Patient, tumor, and fiducial marker characteristics.
Figure 1. Delineations of patient 5 on the planning computed tomography without (left) and with markers (right). The delineations of the individual observers are indicated in different colors. The colors match the same observer throughout this work. Red arrows indicate fiducial markers. Insert demonstrates transversal slice without delineations.
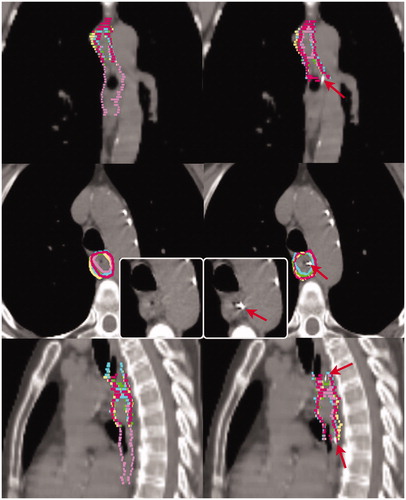
Figure 2. Anterior view of the local surface distance variation (SD) over the five observers projected on the median surface of the 10 patients in the series without and with markers. Column (a) the original series (b) the repeated series.
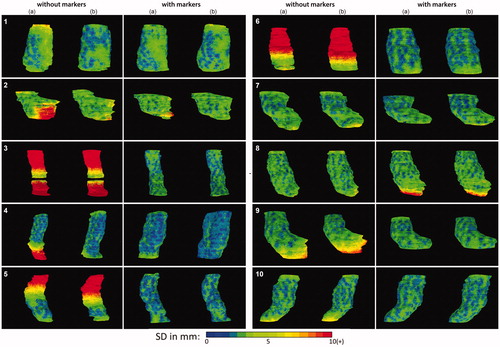
Table 2. Inter-observer overall SD as well as longitudinal and radial SDs of delineations on CTs without (left columns) and with (right columns) markers.
Table 3. Intra-observer overall SD as well as longitudinal and radial SDs of delineations on CTs without (left columns) and with (right columns) markers.