Figures & data
Table 1. Planning Target Volume (PTV) and Organs-At-Risk (OAR) planning optimization objectives.
Figure 1. Median cumulative patients dose volume histograms for the PTV (a) and median cumulative patient dose–surface histogram for the skin (b).
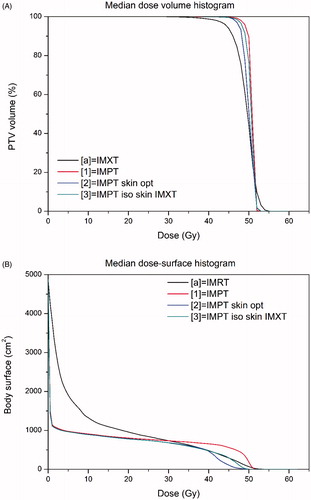
Figure 2. Comparison of intensity modulated photon therapy (IMXT) plan (left), intensity modulated proton (IMPT1) therapy (middle), and IMPT2 (right) dose distributions in two representative patients.
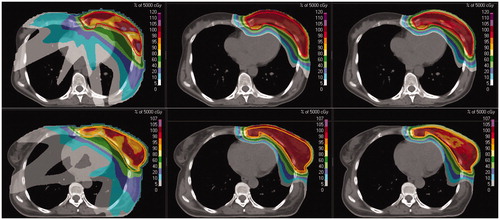
Table 2. Dose distribution indices for the PTV and pseudo target volumes (Skin3mm and superficial PTV-breast structures).
Table 3. Dosimetric parameters and comparative analysis for different organs for intensity modulated photon (IMXT) and intensity modulated proton without (IMPT1) and with skin included in the cost function (IMPT2).
Figure 3. Patients normal tissue complication probability (NTCP), odds ratio (OR), and hazard ratio (HR) values for different organs and endpoints for intensity modulated photon therapy (IMXT) and for intensity modulated proton therapy plans without (IMPT1) or with skin included in the cost function (IMPT2).
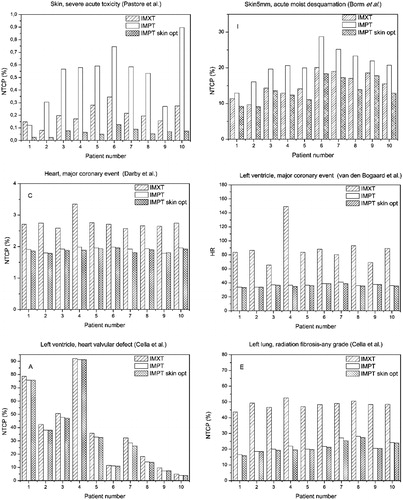
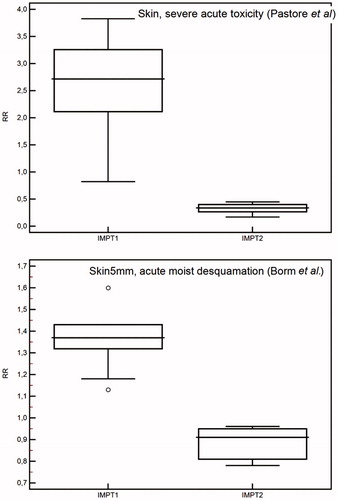
Table 4. Relative risk (RR) ratios comparison according to normal tissue complication probability analysis for severe acute skin toxicity for intensity modulated proton plan without (IMPT1) and with skin included in the cost function (IMPT2).
Figure 4. Relative risk (RR) ratio comparison for skin morbidity according to different normal tissue complication probability (NTCP) models for intensity modulated proton plans without (IMPT1) and with skin included in the cost function (IMPT2).