Figures & data
Figure 1. Consort diagram.
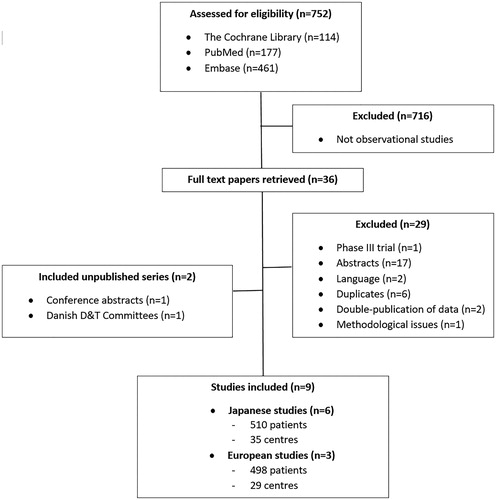
Table 1. The included studies.
Figure 2. Funnel plots. Funnel plots with pseudo 95% confidence limits for median progression free survival (left) and median overall survival (right). The dotted lines illustrate the pooled estimates.
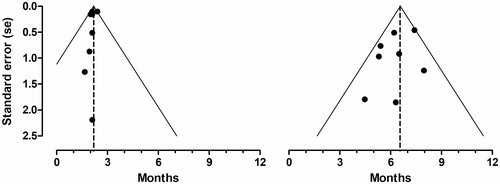
Figure 3. Forest plots. Pooled analyses of median progression free survival (top) and median overall survival (bottom). A black box that also gives a representation of the size of the study represents point estimates of the individual studies with 95% confidence intervals. The white summary diamond shows the pooled estimate from a fixed effect model. The grey dots at the bottom represents point estimates from the trifluridine/tipiracil-arms of the three efficacy studies with 95% confidence intervals.
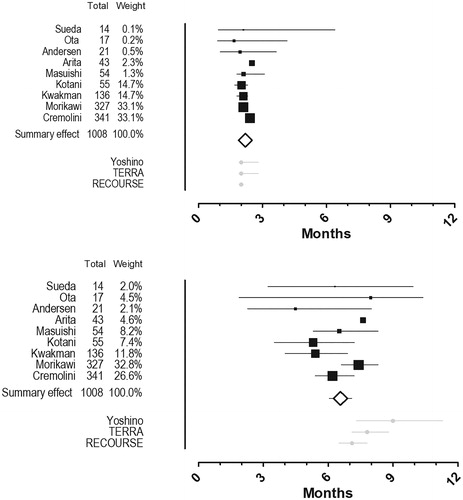
Table 3. Median progression free survival (mPFS), median overall survival (mOS), and restricted mean survival times in the phases II and III trial and the current analysis of observational studies.
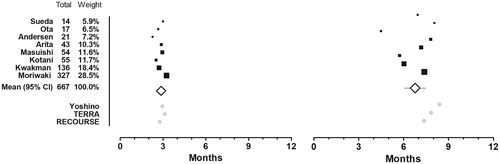
Figure 4. Mean restricted survival time. Mean progression free survival time restricted at 6 months (left) and overall survival time restricted at 12 months (right). A black box that also gives a representation of the size of the study represents point estimates of the individual studies. The white summary diamond shows the weighted mean with 95% confidence interval. The grey dots at the bottom represents point estimates from the trifluridine/tipiracil-arms of the three efficacy studies.