
Figures & data
Figure 1. Time trends in the age-standardised, stage-specific incidences of CMM in men and women, respectively.
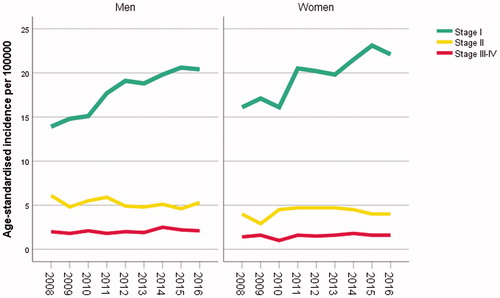
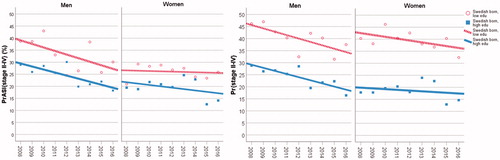
Figure 2. The suggested basic statistics, PrASI{stages II–IV}, compared to the conventional one, Pr{stages II–IV}. The calculated values on these statistics and corresponding linear regression lines are shown for Swedish-born men with high and low educational level, and for in Swedish-born women with high and low educational level.
Supplemental material