Figures & data
Figure 1. Workflow of delineation propagation from the planning CT to per-treatment image (head-and-neck). The planning delineations are propagated by means of the deformation vector field estimated by DIR. The propagated delineations are validated by the physician and corrected if needed. DIR: deformable image registration.
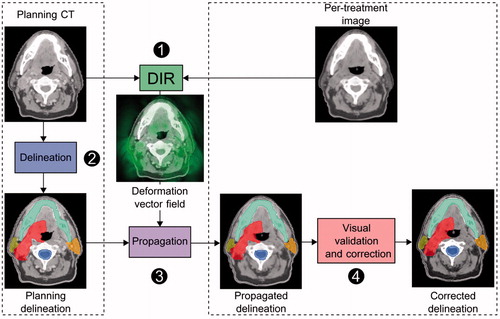
Figure 2. Workflow of cumulated dose estimation by deformable image registration. Step 1: a deformable image registration is computed between the per-treatment images and the planning CT image. Step 2: the fraction doses are calculated from the per-treatment images with the same treatment parameters as the planning. Step 3: the fraction dose distributions are propagated to the planning CT by means of the resulting deformation vector fields. Step 4: the propagated dose distributions are summed to compute the cumulated dose on the planning CT. The planned dose can be compared to the estimated cumulated dose.
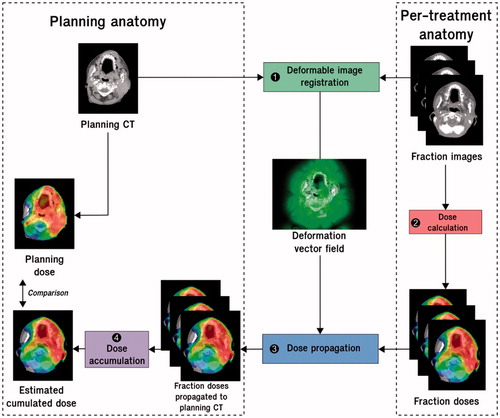
Figure 3. Cumulated DVH should not be estimated as the mean fraction DVH. DVH: Dose volume histogram. A pelvic numerical phantom was designed (A) to compare dose accumulation using ground truth accumulated dose (in red) and DVH averaging (in blue) in the bladder for prostate cancer irradiation. The fraction dose DVHs are in gray (normalized to the total dose). The ground truth accumulated dose was obtained by propagating the fraction doses to the planning using the reference DVF resulting from biomechanical laws (Supplementary Material). The cumulated dose appears superior to the planned dose. The mean fraction dose overestimates the dose received by the bladder.
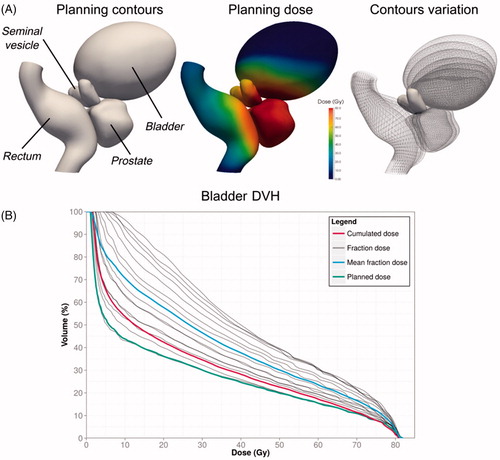
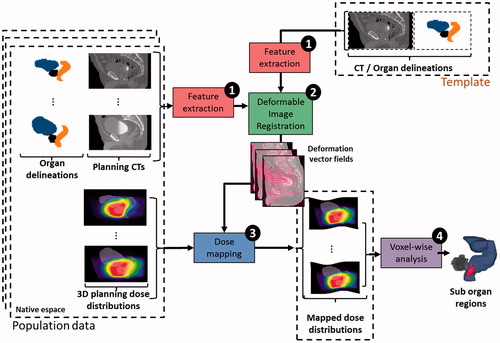
Figure 4. Workflow of voxel-based analysis using deformable image registration for patient toxicity prediction. Step 1: feature extraction is done on the population data and anatomical template (i.e., preprocessing); step 2: a DIR method is used to compute the inter-individual deformation vector fields (DVF). Step 3: the resulting DVFs are used to propagate the 3D planning dose distributions of the population on the anatomical template coordinate system; step 4: a local statistical analysis of dose–effect relationship is performed.