
Figures & data
Table 1. Patient characteristics in the unmatched cohort.
Figure 1. Kaplan–Meier curves showing the difference in overall survival between HPV positive and negative patients with early compared to locally advanced disease.
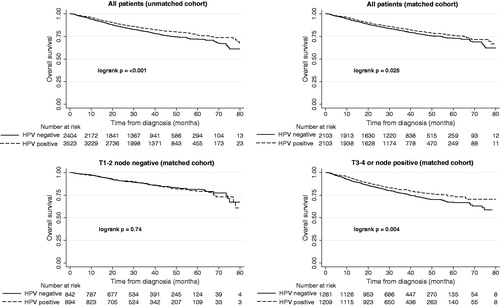
Table 2. Patient characteristics in the propensity-matched cohort.
Table 3. Multivariable Cox proportional hazards regression for overall survival in the matched cohort.
Table 4. Multivariable Cox regression analysis showing the independent association between overall survival and total radiation dose.
Supplemental material