Figures & data
Figure 1. (a) Dose metrics for endocrine structures per patient compared for VMAT and proton plans. Pediatric dose threshold indicated. (b) Estimated probability of complication per patient. Equal dose and risk indicated by solid line, ±10% relative difference in risk indicated by dashed line. Excluding patients with risk <1%, gives 14/38 patients in favor of PT by 10% relative difference in risk (upper left side), and 6/38 in favor of VMAT (lower right side).
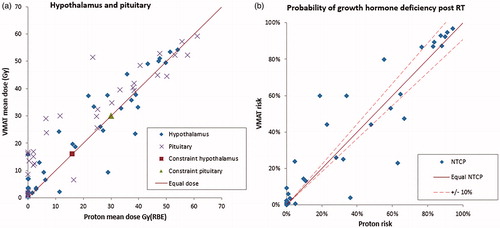
Figure 2. Dose metrics related to cognition compared for VMAT and proton plans per patient for (a) the supratentorial brain, (b) the temporal lobes and (c) the hippocampi. (d) Estimated probability of decline in IQ points complication for a patient. Equal dose and risk indicated by solid line, ±10% relative difference in risk indicated by dashed line.
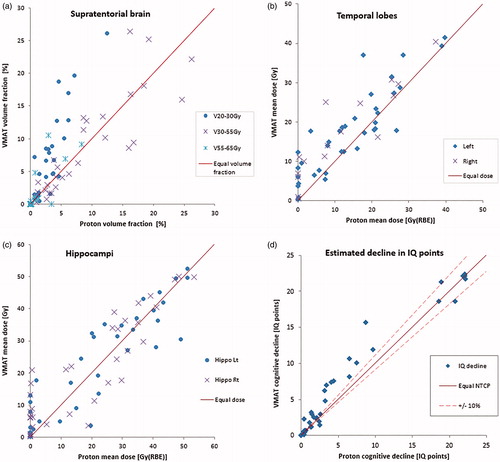
Table 1. Estimated risk of complications.
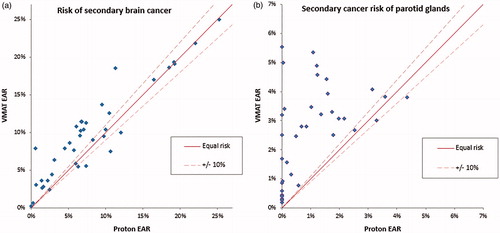
Figure 3. Estimated risk of radiation-induced secondary cancer of the (a) brain and (b) the parotid glands. Solid line indicates equal risk, with ±10% relative deviation in risk indicated by the dashed line.