
Figures & data
Figure 1 The IMRT polystyrene solid slab phantom with the IMRT QA insert disassembled and showing the location of PTV_I_TLD, OAR_I_TLD and EBT 3 film (a) and a cross section of the IMRT QA insert showing the TLD locations in the PTV and OAR (b).
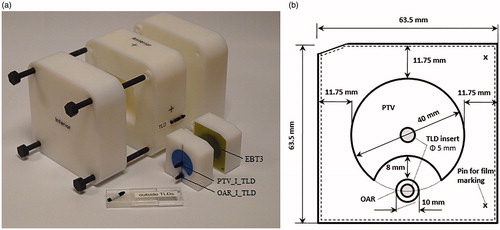
Figure 2. Relation between the TLD signal and the CTDI doses.
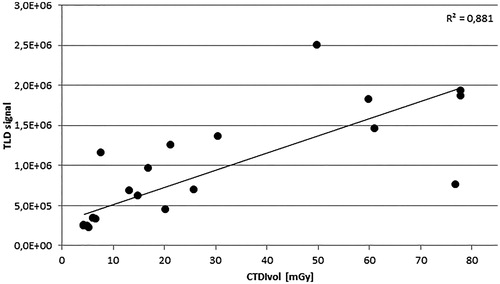
Figure 3. TLD results for multicentre study and national trials; TLD locations marked as: PTV_S_TLD and PTV_I_TLD for the superior and inferior positions in the PTV and OAR_S_TLD and OAR_I_TLD for the superior and inferior positions in the OAR. (a) ratio of the TLD measured to stated doses for each institution from the multicentre study (the ±5% acceptance level applicable for PTV only is shown in red), data for institutions 2, 5 and 10 include the initial (1) and repeated (2) irradiation results. (b) TLD dose measurement results in OAR for each institution from the multicentre study (the 2.8 Gy acceptance limit is shown in red), data for institutions 2, 5 and 10 include the initial (1) and repeated (2) irradiation results. (c) ratio of the TLD measured to stated doses for each institution from the national trials (the ±5% acceptance level applicable for PTV only is shown in red); (d) TLD dose measurement results in OAR for each institution from the national trial (the 2.8 Gy acceptance limit is shown in red).
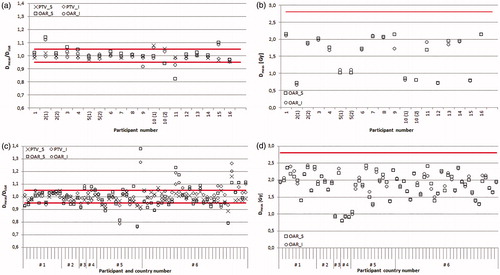
Figure 4. Comparison of measured and TPS calculated profiles; the IMRT QA insert with regions and cross-sections marked (a), vertical profile along the axis passing through the isocentre (A-A) (b), horizontal profile along the axis passing through the isocentre (B-B) (c) and a horizontal profile along the axis passing through the OAR midpoint (C-C) (d).
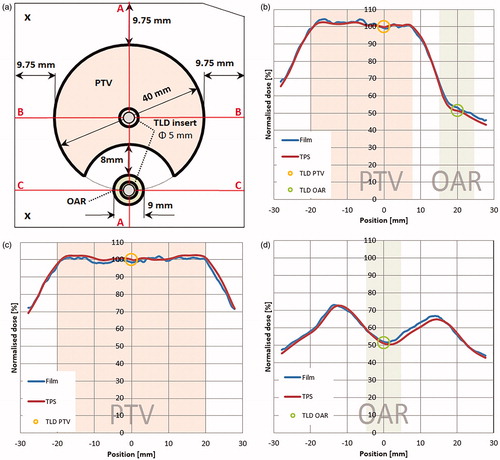
Table 1. Average results of TLD measurements for all national trial runs.