
Figures & data
Figure 1. The differences in TMAs in the SI direction for each fraction and patient: (a) the amplitude difference between TMAorg and TMA4D and (b) the amplitude difference between TMAbs and TMA4D. The error bars are the SDs of amplitude difference over fractions for a patient.
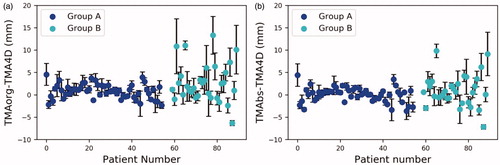
Table 1. The PTV margins calculated for the two groups in the SI, LR and AP directions.
Supplemental material