
Figures & data
Table 1. Clinical and pathological characteristics of RCC patients stratified according to NLR level.
Figure 1. Kaplan-Meier curves for overall survival according to (A) NLR and (B) NLR and serum sodium groups at time of initial RCC diagnosis.
NLR: neutrophil-lymphocyte ratio; RCC: renal cell carcinoma; LLN: lower limit of normal.
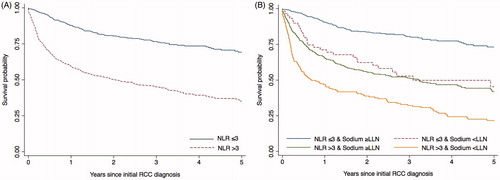
Table 2. The association between NLR at time of initial RCC diagnosis and mortality.
Table 3. The association between NLR at time of initial RCC diagnosis and mortality. Results from stratified analysis.
Table 4. The combined prognostic effect of NLR and serum sodium at time of initial RCC diagnosis.
Supplemental material