Figures & data
Table 1. Organs at risk in the DAHANCA validation cohort.
Figure 1. Calibration plot for the original and intercept refit models. The patients were grouped in to 10 equally sized groups (filled black circles) and the binominal uncertainty equal to one standard deviation is displayed in the error bars. The raw data are displayed as open gray circles with added noise, to illustrate the patient density.
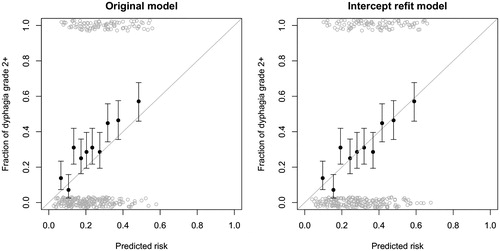
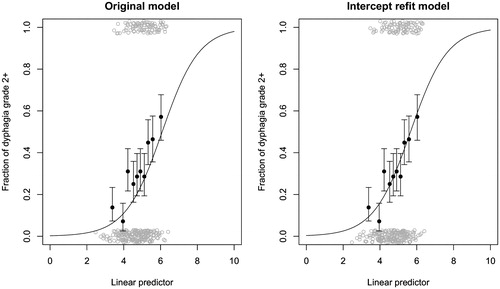
Figure 2. Linear predictor plot for the original and intercept refit models. Linear predictor original model (–6.09 + 0.057 × PCM superior Dmean+0.037 × supraglottic larynx Dmean) and intercept refit model (–5.66 + 0.057 × PCM superior Dmean+0.037 × supraglottic larynx Dmean). The patients were grouped in to 10 equally sized groups (filled black circles) and the binominal uncertainty equal to one standard deviation is displayed in the error bars. The raw data are displayed as open gray circles with added noise, to illustrate the patient density.