Figures & data
Table 1. Patient characteristics for the early and late progression group.
Figure 1. Hierarchical cluster analysis showing the 81 significantly altered genes (p<.01) with fold changes of ±1.2 in primary tumors of older HGSC patients (>70 years) with early (<6 months, 20 patients, blue) versus late disease progression (>12 months, 30 patients, yellow). Red: higher levels, green: lower levels in the early versus late disease progression group. Heatmaps were generated using the Qlucore Omics Explorer™ software. The ARAP1 gene selected for further analysis is marked in the heat map with thin white lines.
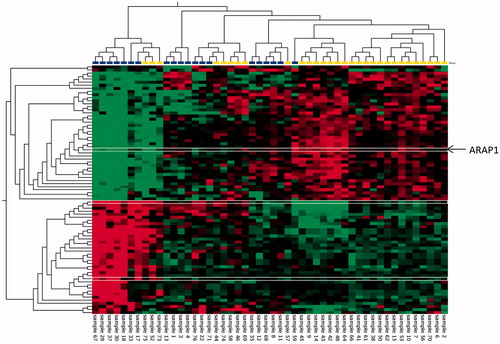
Figure 2. Staining intensity for ARAP1 correlates with time to progression. Immunohistochemistry showing weak and strong intensity of ARAP1 staining, respectively, in HGSC samples. (A) Weak intensity. Example from the early progression group. (B) Strong intensity. Example from the late progression group. Scale bar: 100 µm.
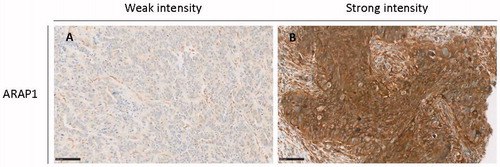
Table 2. Intensity of ARAP1 staining in the discovery and validation populations.
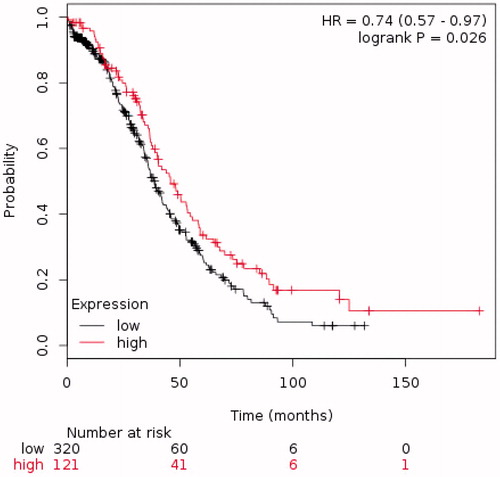
Figure 3. The Kaplan–Meier plot assessing the effect of ARAP1 expression on overall survival (OS) in a publically available dataset of 441 HGSC ovarian cancer patients.