Figures & data
Table 1. Baseline characteristics for men with de novo metastatic prostate cancer in Prostate cancer data Base Sweden (PCBaSe) 4.0.
Figure 1. Median and lower quartile level of serum PSA at diagnosis for men with metastatic prostate cancer by calendar year and age groups in PCBaSe 4.0.
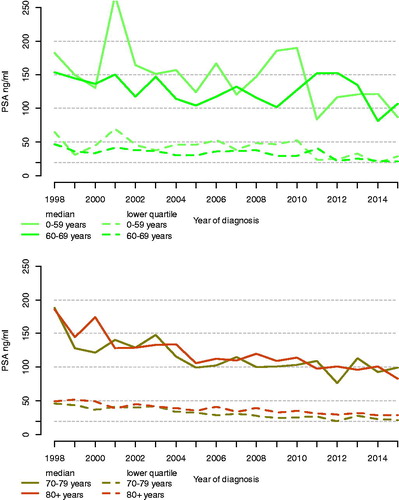
Figure 2. Median overall survival by calendar period in men with metastatic prostate cancer in Prostate Cancer data Base Sweden (PCBaSe) 4.0. Vertical bars indicate 95% confidence intervals.
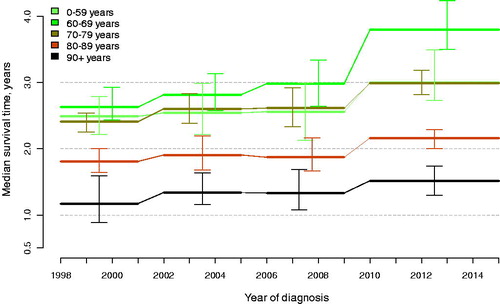
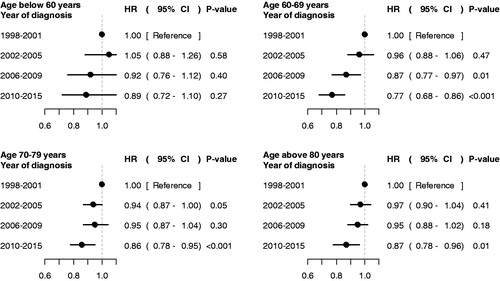
Figure 3. Overall survival for men with metastatic prostate cancer in PCBaSe 4.0. Hazard ratios (HR) in Cox proportional hazard regression model for overall survival in men with metastatic prostate cancer according to calendar period, controlling for symptomatic or asymptomatic status at start of work-up leading to prostate cancer diagnosis, serum level of prostate specific antigen (PSA), clinical T stage, age at diagnosis, Charlson comorbidity index and educational level.