
Figures & data
Table 1. Baseline patient characteristics.
Figure 1. IMPT and VMAT re-planning frequencies for treatment-trajectories with and without re-planning. Decisions to re-plan were based on the weekly repeated 4DCTs only, i.e., without dose accumulation. Whole-course ICTV coverage was evaluated with dose accumulation on the average planning 4DCT.
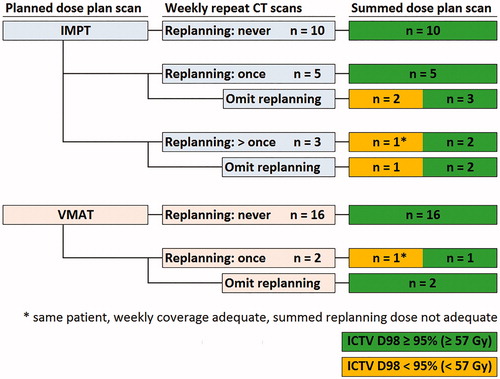
Figure 2. Dose volume histograms for heart and lungs contours with VMAT and IMPT (accumulated dose including re-planning).
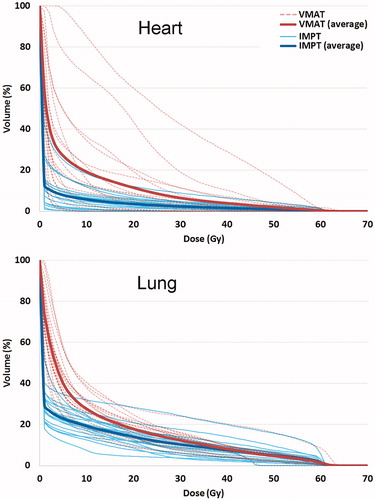
Figure 3. Accumulated dose distributions with VMAT and IMPT and mean heart dose reductions with IMPT in a subgroup of patients with substantial cardiac sparing with IMPT.
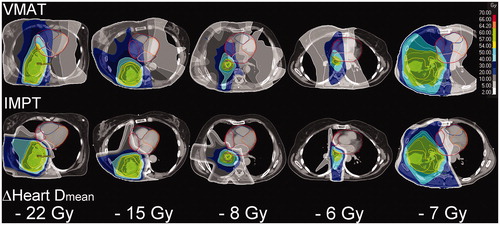
Table 2. Full re-planning trajectories ICTV D98 and OAR mean dose summed on av_p4DCT.
Supplemental material