
Figures & data
Figure 1. Flow diagram showing inclusion and exclusion of studies.
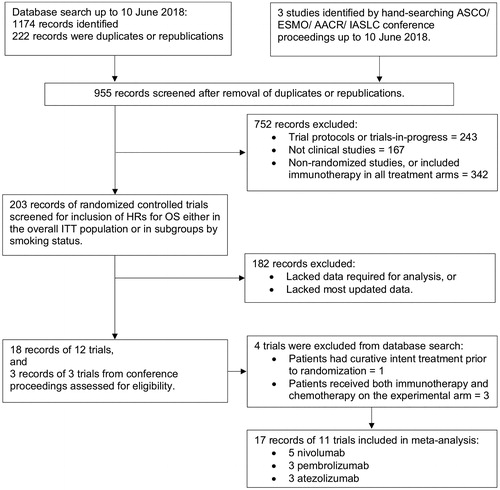
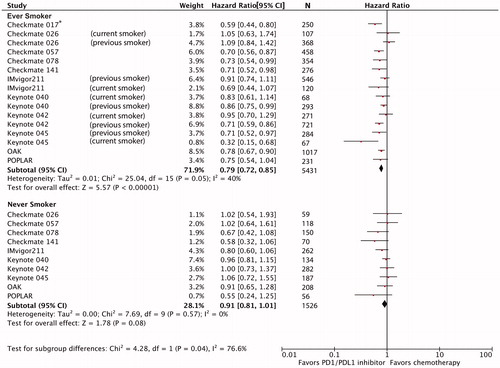
Figure 2. Forest plot of hazard ratios for overall survival comparing immune checkpoint inhibitors versus chemotherapy in ever-smokers and never-smokers patient subgroups. Hazard ratio for each trial is represented by the square and the horizontal line crossing the square represents the 95% confidence interval (CI). The diamond represents the pooled overall effect size estimated using a fixed-effect meta-analysis. All statistical tests were two-sided. *Hazard ratio could not be estimated for never-smoker subgroup because there were only 17 patients in CHECKMATE 017 trial.
Supplemental material