
Figures & data
Table 1. Patient characteristics in each group.
Table 2. Chemotherapy regimens administered to the treatment line matched non-eribulin group, n = 45.
Figure 1. Comparison of progression-free survival (A) and overall survival (B) between the eribulin and the treatment line matched non-eribulin group. CI: confidence interval; OS: overall survival; PFS: progression-free survival.
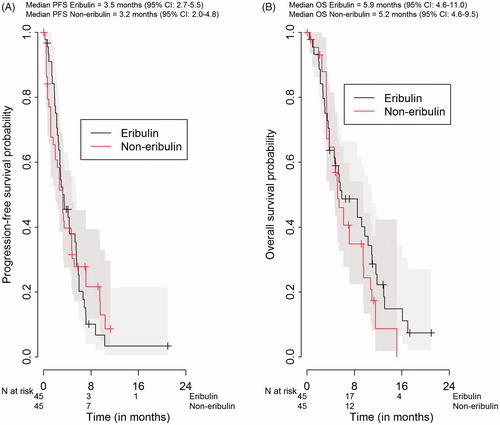
Table 3. Results of the multivariate Cox proportional hazard models.
Table 4. Overview of adverse events leading to dose delay or reduction in the eribulin group, n = 45.
Supplemental material