Figures & data
Figure 1. Forest plot of objective response rates for docetaxel. The point estimate of response rate for each trial is represented by the filled diamond, and the horizontal line crossing the diamond represents the 95% confidence interval (CI). The open diamond represents the pooled overall effect size. Japanese trials refer to studies originating in Japan. Non-Japanese trials may include Japanese subjects but refer to studies originating outside Japan.
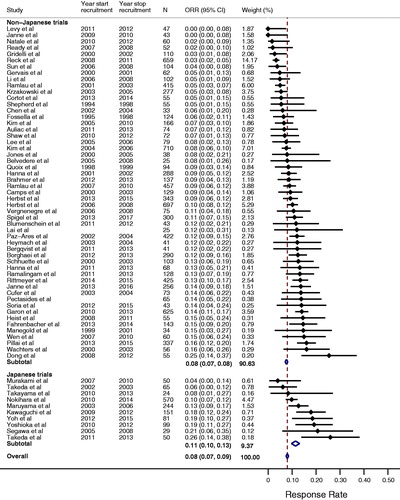
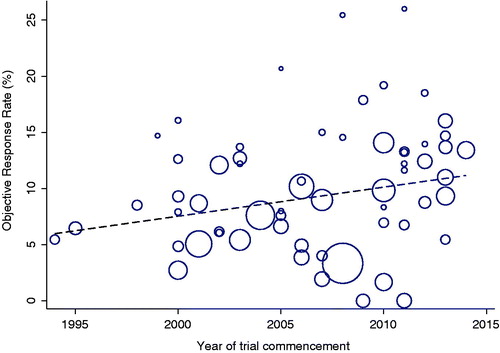
Figure 2. Distribution of tumor objective response rate over year of trial commencement. Each circle represents a trial. The circle size is inversely proportional to the standard error of the response rate. The dashed line is a fitted regression line of the relationship of objective response rate with year of trial commencement.