
Figures & data
Figure 1. Hypothesised causal relations between the socioeconomic position (educational level, disposable income and cohabitation status) and grade, stage and tumour size at time of diagnosis.
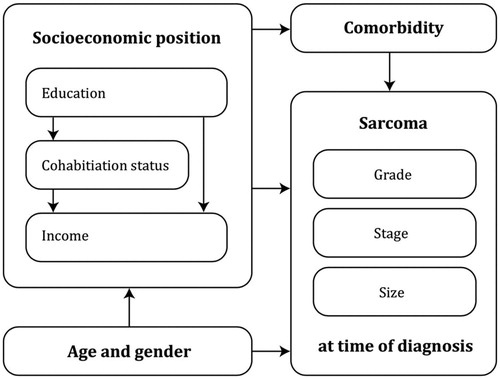
Table 1. Patient characteristics for the 1919 sarcoma patients diagnosed with sarcoma in Denmark 2000–2013.
Table 2a. Associations (odds ratios (ORs) with corresponding 95% confidence intervals (CI)) between socioeconomic position and having high grade (grade II + III) sarcoma in 1751 patients aged ≥30 years in Denmark, 2000–2013.
Table 2b. Association (odds ratios (ORs) with corresponding 95% confidence intervals (CI)) between socioeconomic position, and disseminated sarcoma in 1919 patients aged ≥30 years in Denmark, 2000–2013.
Table 3. Associations (odds ratios (ORs) with 95% confidence intervals (CI)) between socioeconomic position, and having a larger sarcoma (≥5 and ≥8 cm) at time of diagnosis in 1626 patients aged ≥30 years in Denmark, 2000–2013.
Table 4. Mortality rates and crude and adjusted hazard ratios with 95% confidence intervals (CI) for all sarcoma patients (n = 1919) and stratified for socioeconomic position, age, gender, comorbidity, grade, stage, and tumour size in Denmark 2000–2019.