Figures & data
Table 1. Clinicopathological characteristics of PTLD cases by CD30 status.
Figure 1. Immunohistochemical staining of CD30 in PTLD after solid organ transplantation. (A) Polymorphic PTLD with approximately 10% CD30+ cells. (B) Diffuse large B-cell lymphoma, non-germinal center type, with approximately 80% CD30+ tumor cells. (C) Anaplastic large cell lymphoma with 100% CD30+ tumor cells D) Hodgkin lymphoma-like PTLD with 100% CD30+ Hodgkin and Reed/Sternberg (HRS) cells.
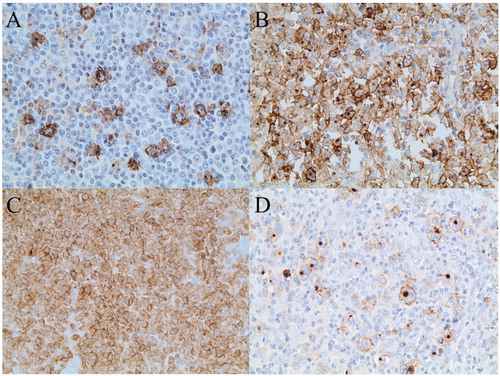
Figure 2. Overall survival in PTLD after solid organ transplantation by CD30-status overall (A), in the subgroup of DLBCL (B), and the subgroup of T-cell PTLD (C).
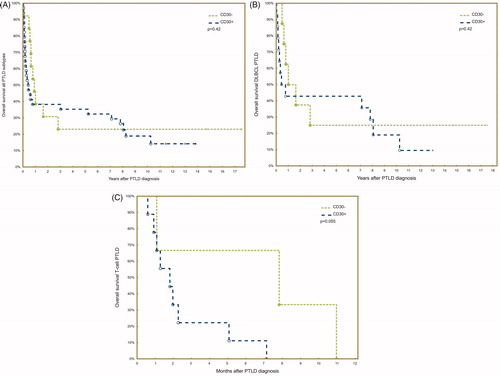
Table 2. Uni- and multivariate analysis of CD30 and overall survival with the use of Cox proportional hazards regression, adjusting for age, sex, and stage according to Ann Arbor.
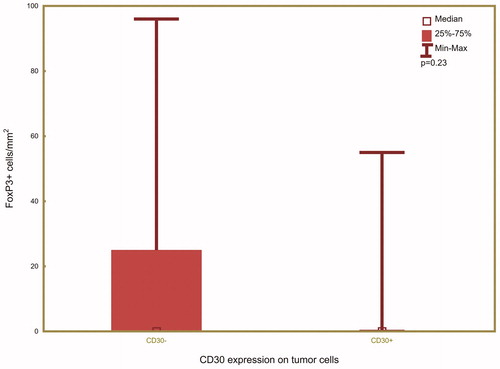
Figure 3. Association between expression of CD30 and FoxP3, a biomarker for regulatory T-cells.