
Figures & data
Figure 1. Dot chart summarizing relevant dose parameters for toxicity. Each patient is represented by a white dot; bar represent the value associated with Youden J. (A) Daily D2 to duodenum in patients with with (right) or without (left) acute nausea. (B) Daily D10 to stomach in patients with (right) or without (left) abdominal pain. (C) Daily D10 to bowel in patients with (right) or without (left) acute diarrhea.
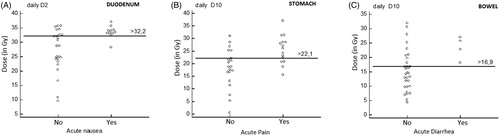
Table 1. Median comparison (Kruskall–Wallis Test) for selected parameters between patients with or without acute toxicity following SBRT.
Supplemental material