
Figures & data
Figure 1. Adjusted* odds ratios of participation by any visits (≥1 in the 2-year period compared to no visits). *Adjusted for sex, age, education, income, ethnicity, civil status, and year of invitation.
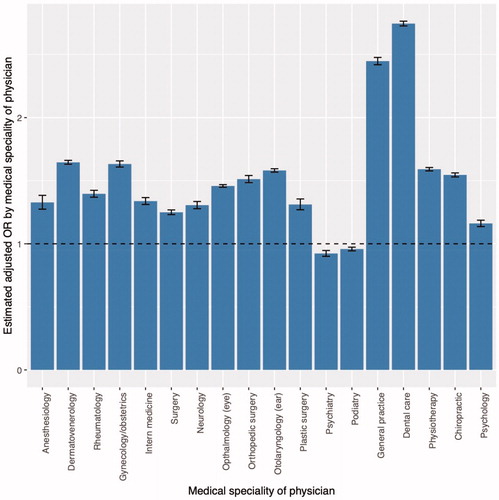
Table 1. Unadjusted and adjusted* odds ratios of participation in the Danish colorectal cancer screening by visits to a general practitioner, dentist, and psychiatrist.
Supplemental material