
Figures & data
Table 1. Baseline characteristics of 200 consecutive patients with proximal esophageal cancer treated with definitive chemoradiation (2004–2014).
Figure 1. Kaplan–Meier curves for overall survival by treatment, intention-to-treat analysis. Cis/low: cisplatin and low-dose radiotherapy; Cis/high: cisplatin and high-dose radiotherapy; CP/low: carboplatin/paclitaxel and low-dose radiotherapy; CP/high: carboplatin/paclitaxel and high-dose radiotherapy.
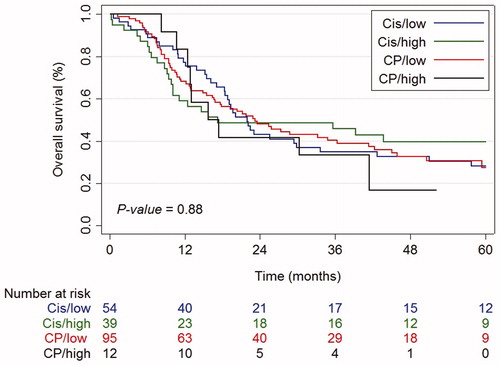
Table 2. Univariable and multivariable comparison of overall survival by four definitive chemoradiation regimens, and propensity score adjusted for overall survival.
Table 3. Adverse events, No. (%).
Table 4. Multivariable multilevel (patients within centers) analyses of grades 3–5 acute and late toxicity.