Figures & data
Figure 1. 3D image-guided planning using Plaque Simulator. (A) Recreated tumour position and relative distances to the macula and the optic disc on pre-treatment fundus photography. (B) Retrospectively recreated plaque position based on radiation scar on post-treatment fundus photography. (C) 3D dose distributions were recreated based on the exact treatment time extracted for each patient. The 200 Gy, 100 Gy, and 20 Gy isodose lines are shown. (D) 3D illustration of the recreated treatment plan showing plaque position, the tumour, macula, and optic disc. An anterior view was chosen for illustration purposes.
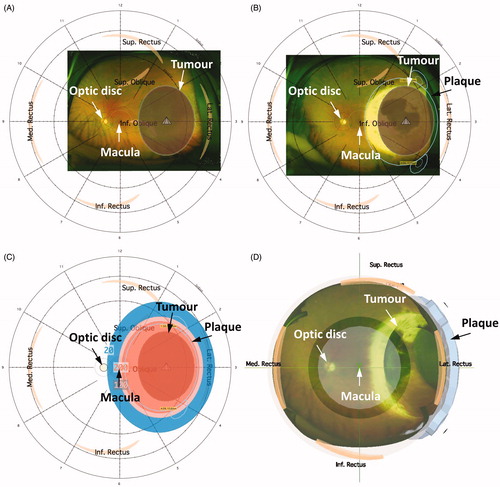
Table 1. Patient-, tumour-, and treatment characteristics.
Figure 2. (A) A Kaplan-Meier curve for local control for the entire patient population. Dotted lines: 95% confidence intervals; crosses: censored patients. (B) Tumour control probability (TCP) at 3 years with 95% confidence interval using D99%. The TCP curve adjusted for tumour height of 3.9 mm (median height of cohort), no combined TTT and Ru-106 treatment (most common in the cohort), and male sex (most frequent in the cohort). (C) TCP curve at 3 years using BED99%. The TCP curve used no combined TTT and Ru-106 treatment (most common in the cohort) and male sex (most frequent in the cohort). Both TCP curves (B and C) were based on Cox proportional hazard regression, and the data points represent Kaplan-Meier estimates at 3 years after stratifying into four dose groups (for illustration purpose only).
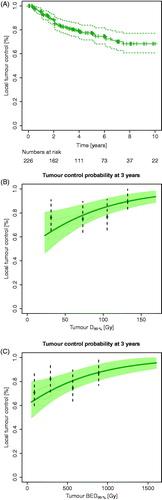
Table 2. Cox proportional hazards.
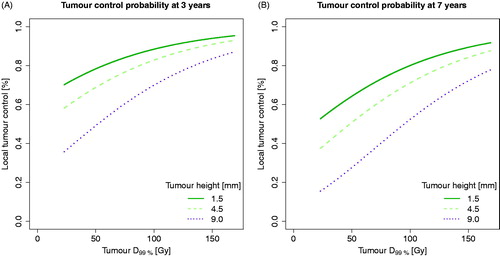
Figure 3. Tumour control probability (TCP) curves taking dose and tumour height into account (tumour heights based on mean values of each tumour staging group). (A) TCP for D99% at 3 years. (B) TCP for D99% at 7 years. TCP curves were based on Cox proportional hazard regression, using no combined TTT and Ru-106 treatment (most common in the cohort) and male sex (the most frequent sex in the cohort).