
Figures & data
Table 1. Number of women and person-year of the study cohorts, in total and by screening history in the preceding two screening intervals.
Figure 1. Age-standardised incidence rate of invasive cervical cancer 2002–2015 among women unscreened (a) and adequately screened (b) in the preceding two screening intervals.
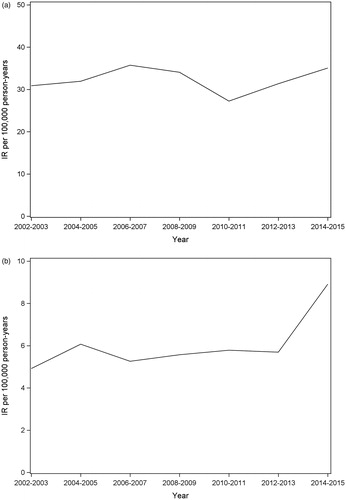
Table 2. Incidence rate ratio of invasive cervical cancer in 2014–2015 compared to 2002–2013, among women adequately screened with normal results and women unscreened in the preceding two screening intervals.
Figure 2. Incidence rate of invasive cervical cancer over year since a normal smear, by year of the smear.
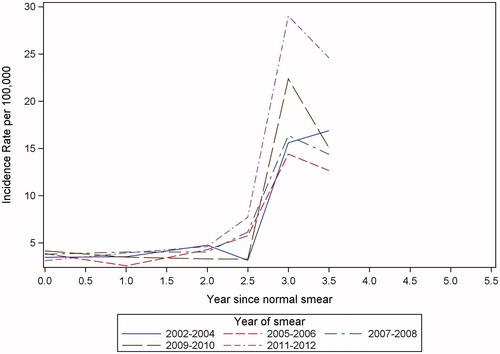
Table 3. Incidence rate ratio of invasive cervical cancer in different follow-up periods after a normal smear, comparing 2009–2012 to 2002–2008 at smear taken.