
Figures & data
Table 1. Patient characteristics.
Table 2. EORTC-QLQ-C30 scores.
Figure 1. EORTC-QLQ-C30 functioning scores per symptom cluster and normative population. Bar charts showing EORTC-QLQ-C30 global QoL and functioning scores for (a) the low symptomatic cluster and its normative population, (b) for the intermediate symptom burden cluster and its normative population and (c) for the highly symptomatic cluster and its normative population. *p < 0.05, **p < 0.01, ***p < 0.001, #normative population for that particular symptom cluster.
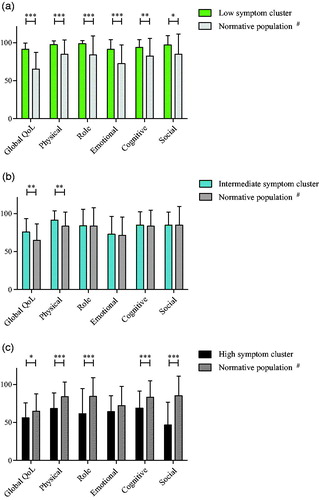
Figure 2. EORTC-QLQ-C30 symptom scores. Spider plot showing EORTC-QLQ-C30 symptom scores of the low, intermediate and highly symptomatic cluster on a 0-100 scale, with higher scores indicating more complaints.
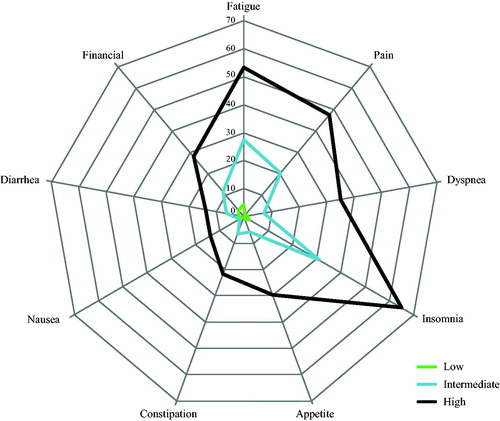
Table 3. Psychological distress.