Figures & data
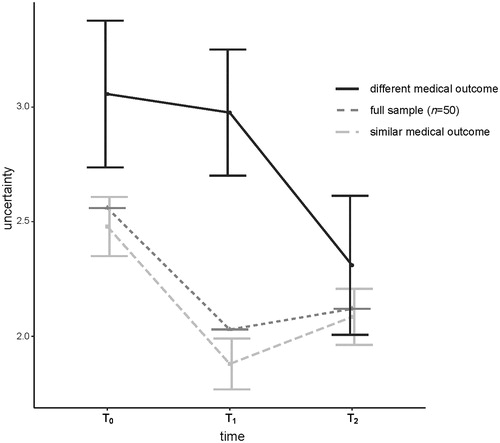
Figure 1. Flow chart of participant inclusion and overview of the SO-COM study procedures (incl. survey measures used in the presented analyses). Note: *N = 77 includes every respondent who provided self-report and/or had their SO audio-recorded, of which N = 72 had provided self-report data and complete data was available from N = 70 patients at T0.
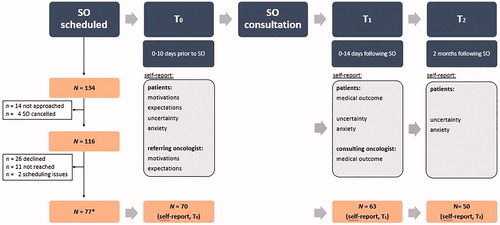
Table 1. Background characteristics of all patients (N = 70).
Table 2. Patient- and oncologist-reported motivations and expectations of seeking a SOa.
Table 3. Descriptive statistics of patient- and oncologist-reported outcomes, and effects over time.
Figure 2. Estimated marginal means of uncertainty from T0-T2 for patients split by self-reported medical outcome (similar vs. different SO); and observed means for the full sample across three time points.