Figures & data
Figure 1. Study flow diagram showing number and type of NGS tests requested in the IRIS network between 2014 and 2019. BC: breast cancer; GI: gastrointestinal; GU: genitourinary; HPB: hepato-biliary-pancreatic; IJB: Institut Jules Bordet; NGS: next-generation sequencing; NSCLC: non-small cell lung cancer.
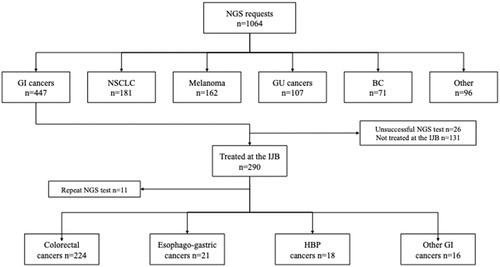
Figure 2. Requests of NGS tests by tumor type received each year by the molecular pathology laboratory at the Institut Jules Bordet over the study period. BC: breast cancer; GI: gastrointestinal cancers; GU: genitourinary cancers; NSCLC: non-small cell lung cancer.
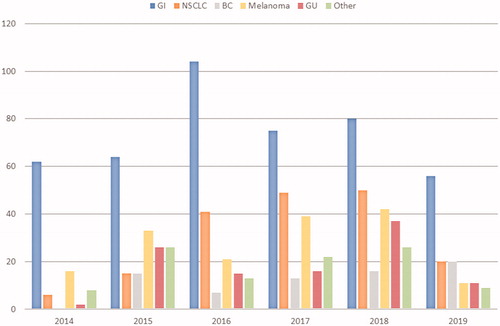
Figure 3. Turnaround time (days) of the 48-gene Truseq Amplicon Cancer Panel by year over the study period (calculated as the time between reception of test request and report of the results).
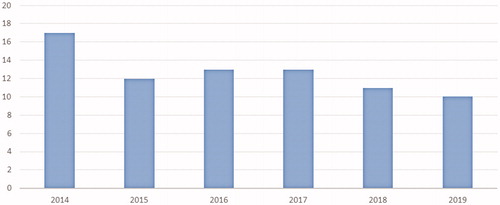
Figure 4. Failure rates of the 48-gene Truseq Amplicon Cancer Panel by year over the study period.
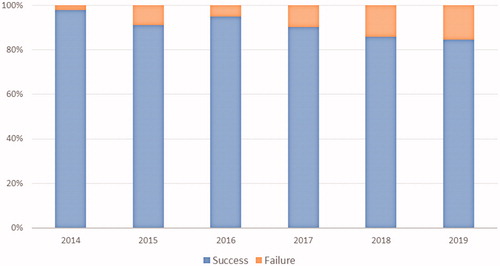
Table 1. Association between variables and NGS success in the study population.
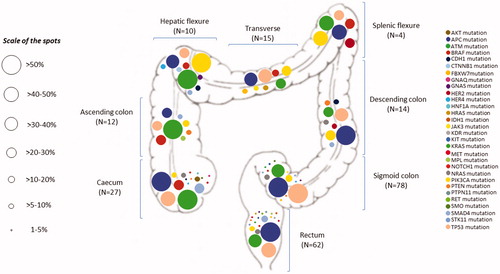
Figure 5. Distribution and proportion by bowel segment of all mutations detected by the 48-gene Truseq Amplicon Cancer Panel in colorectal cancer patients who were managed at the Institut Jules Bordet over the study period (n = 222). The percentages next to each spot indicate the proportion of tumors harboring given mutations within each segment of the bowel.