Figures & data
Figure 1. Exercise impacts intra-tumoral expression of immune regulatory molecules. mRNA expression of immune regulatory molecules in control mice (gray circle) and running mice (orange dot) compared as fold change of ΔΔCt values relative to the control group. (A) B16 melanoma expression of regulatory molecules along with the correlation of Ifnγ expression to Pd-1 (B) and Pd-l1 (C) expression. (D) Immune regulatory molecules in E0771 breast cancer and (E) LLC lung cancer. (F) For UTSCC45 head & neck cancer, ΔΔCt values are shown with gene expressions normalized to the overall ΔCt for mouse Pd-l1 and human PD-L1. All mRNA expressions were normalized to housekeeping genes 18s or Ppia. Statistical significance was tested by multiple t-testing or Mann–Whitney and linear regression analyses with Pearson’s correlation test. Data are depicted as individual datapoints with indication of means. *p < 0.05, **p < 0.01, ***p < 0.001, ****p < 0.0001.
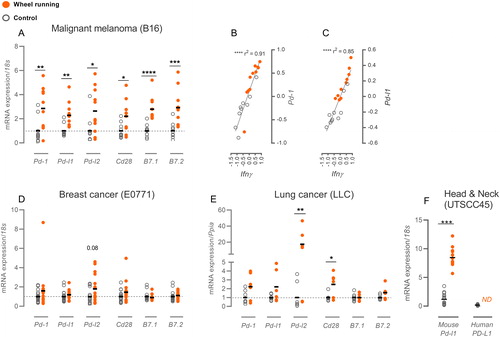
Table 1. Primer sequences.
Figure 2. Combining wheel running and αPD-L1 therapy in B16 melanoma. (A) Tumor volume growth curve of sedentary and wheel running (Wheel) mice treated with PBS or PD-L1 inhibitor annotated ‘αPD-L1’ (n: PBS = 11, Wheel = 8, αPD-L1 = 10, αPD-L1 + Wheel = 11). Growth curves are shown as mean with SD. (C) Tumor weights, (D) change in bodyweight (BW) from time of tumor inoculation, and (E) weight of the spleen were measured at time of euthanization. Data are depicted as individual values with indication of means. Statistical significance was determined by two-way ANOVA with post-hoc Tukey’s multiple comparison test for all panels. *p < 0.05, **p < 0.01, ***p < 0.001.
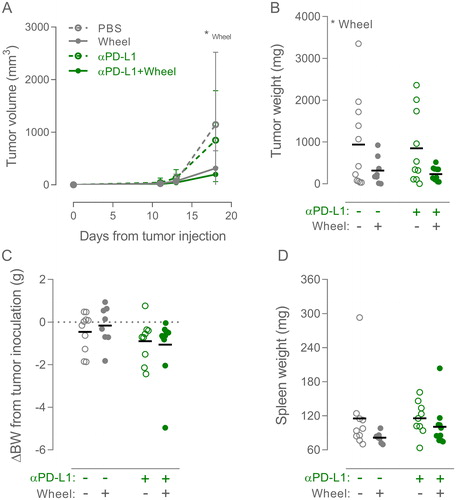
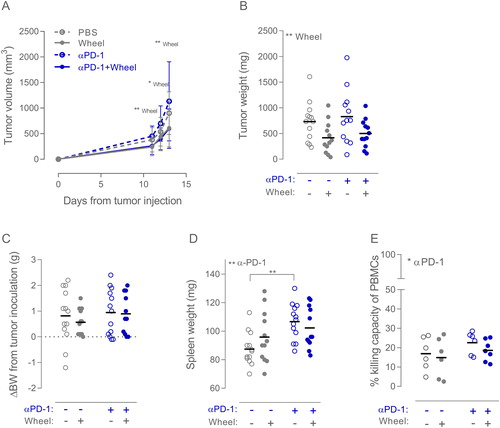
Figure 3. Combining wheel running and αPD-1 therapy in B16 melanoma. (A) Tumor volume growth curve of sedentary or wheel running (Wheel) mice treated with PBS or PD-1 inhibitor annotated ‘αPD-1’ (n: PBS = 13, Wheel = 12, αPD-1 = 12, αPD-1 + Wheel = 12). Growth curves are shown as mean with SD. (B) Tumor weights, (C) change in body weight (BW) from time of tumor inoculation, and (D) weight of the spleen were measured at time of euthanization. (E) Killing capacity of PBMCs isolated from mice from each of the four groups (PBS = 6, EX = 6, αPD-1 = 6, αPD-1 + EX = 7) incubated at E:T ratio of 25:1 with YAC-1 cells. Data are depicted as individual values with indication of means. Statistical significance was determined by two-way ANOVA with post-hoc Tukey’s multiple comparison test for all panels. *p < 0.05, **p < 0.01, ***p < 0.001.